

With 2023 closing to its end, now is an excellent time to take a look back on the overview of the eCommerce scene, to stay up-to-date with the latest eCommerce statistics and trends.
Since market research is hard and time-consuming, we have done the work for you and provided the 2023 eCommerce statistics to aim you with a better chance for success in 2024. In this report, we explore interesting eCommerce stats related to the overview of the market, online shopper statistics, mobile commerce, eCommerce marketing, social media marketing, macro, and micro eCommerce trends. Let’s get started.
Table of Contents
- General eCommerce Statistics
- eCommerce Platform Statistics
- eCommerce Consumer Statistics
- Mobile Commerce Statistics
- eCommerce Marketing Statistics
- Personalization Is the Key to eCommerce Marketing
- Affiliate Marketing Should Be Approached Correctly
- Potential Customers Prefer Stores Offering Live Chat Support
- Majority of Buyers Expect Beneficial Loyalty Programs
- Email Marketing Is Still Effective in Certain Industries
- Video Marketing now Should Be Short & Sweet
- Optimizing Livestream Shopping
- How AI Can Help eCommerce Marketers?
- eCommerce Social Media Statistics
- Social Commerce Sales Are Projected to Surpass $6 Trillion by 2030
- Internet Users Aged 16 to 64 Spend Nearly 40% of Their Online Time on Social Media
- China Is the Social Shopping Leader
- The Number of US Social Buyers Is Still Increasing Fast
- Social Commerce Is Much More Popular among Young People
- Most Marketers Agree That Social Data is Precise, yet Easy to Get
- Making the Most out of UGC on Social Channels
- Brand’s Reputation & Authenticity Can Be Generated and Maintained on Social Channels
- Top Macro eCommerce trends to watch
- 2024 Will Be the AI and Machine Learning Era
- 90% of Businesses Prioritize a Customer-Centric Approach
- Mobile First Approach Should Still Be Prioritized
- Diversity of Marketing Approaches & Methods
- A Challenging Global Supply Chain: Always Readily Have a Mature Planning Capability, Agility, and an End-to-end Forward-looking Visibility
- China, APAC, and Africa Are Potential eCommerce Markets
- Adaptation to Local markets
- Top Micro eCommerce trends to watch
- What to Do with Customer Data?
- Personalization Being Done Right with AI/ML
- Omnichannel to Maximize Revenue
- ERP – CRM to Minimize Costs
- Increasing Customer Support Service Quality
- PWA & Headless eCommerce
- Conversion Rate Optimization
- Voice Search
- Subscription Models
- Diverse Payment Options
- Free, Fast & Convenient Delivery Service
General eCommerce Statistics
How AI & Machine Learning Have Changed the General eCommerce Scene
In recent years, the advent of AI and Machine Learning (ML) in eCommerce has dramatically transformed the landscape, as evidenced by the rapid growth in investment and market expansion. According to Statista’s Global AI software market size report, in 2011, AI technology in eCommerce was nascent, with a mere $25.8 million investment being placed into only seven start-ups. This investment skyrocketed to $1866.6 million by 2016, highlighting a robust 71% growth indicative of AI’s increasing role in revolutionizing eCommerce. The period saw a burgeoning number of startups in the space, rising from 7 to 64, all aimed at harnessing AI for market advantage. The eCommerce industry, driven by AI and ML, has seen a pivot towards hyper-personalization, predictive analytics, and customer service automation. For instance, marketing, sales, and CRM in the eCommerce sector received significant funding, with a combined investment of $753 million by 2018, demonstrating a shift towards AI-enhanced consumer interaction strategies.
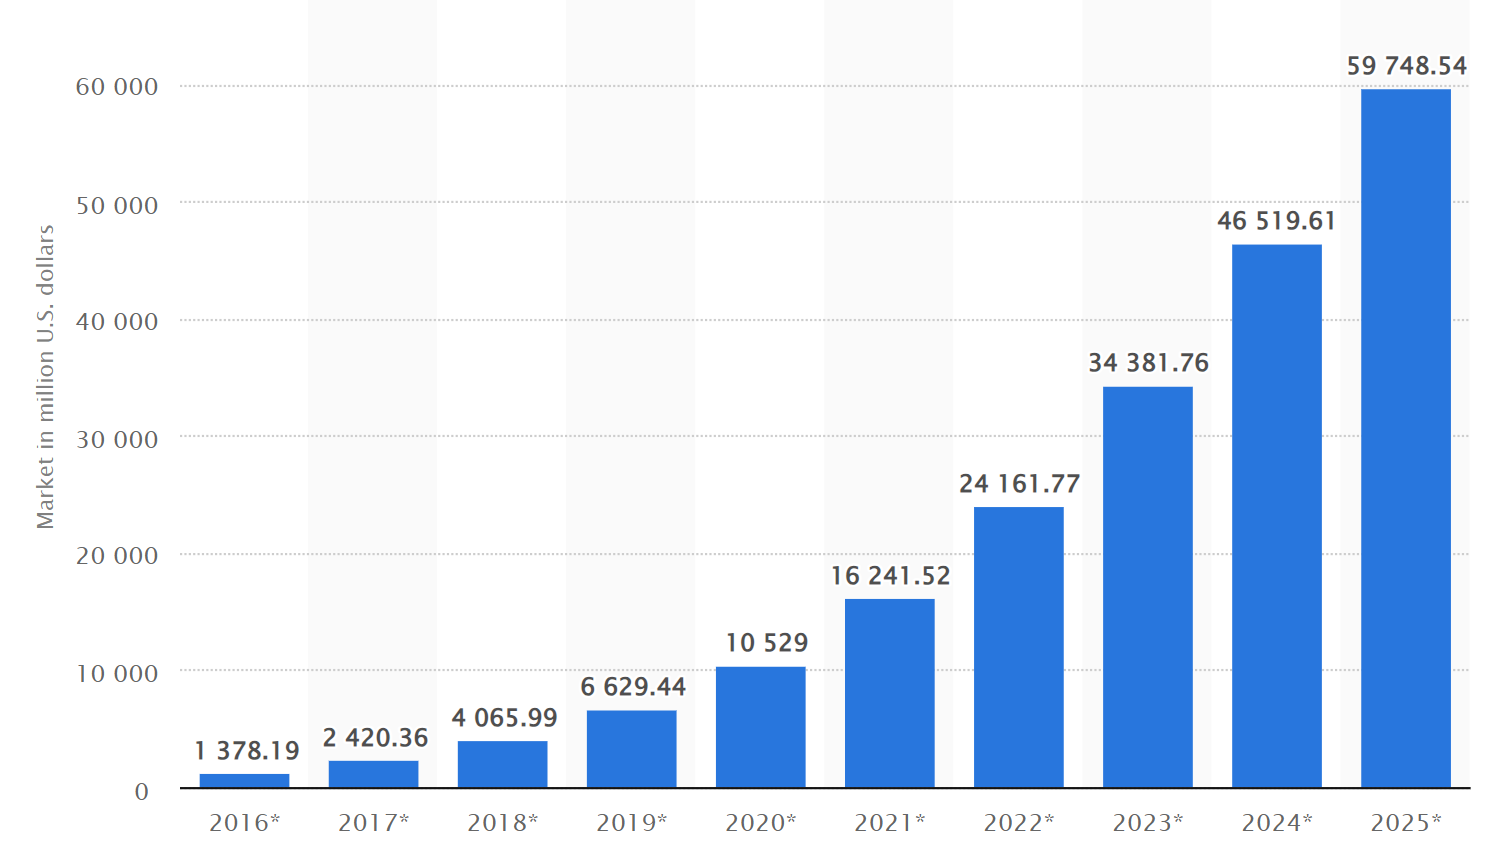
Further, the forecasted global revenue from AI software in eCommerce underscores the scale of this transformation, with projections showing an increase from a market size of around $10 billion in 2018 to an estimated $126 billion by 2025. This suggests a substantial growth in the market’s capacity, buoyed by AI-driven innovation.
The impact of the COVID-19 pandemic further catalyzed the growth of AI in eCommerce. With more consumers shopping online due to lockdowns, companies invested heavily in AI to optimize online sales channels and customer engagement. This is reflected in the expected market growth of 16.4% in AI, reaching $327.5 billion in 2021 and is set to grow to $554.3 billion by 2024.
AI and ML have not just incrementally changed the eCommerce scene; they have been pivotal in its exponential growth and the reimagination of customer engagement and retention strategies. AI-powered chatbots, recommendation engines, and inventory management systems have become standard tools for online retailers, who now rely on AI to understand and predict consumer behavior, manage supply chains, and provide personalized customer experiences. The surge in investment and market value is a clear indicator of AI’s integral role in shaping the present and future of eCommerce.
Global eCommerce Sales Growth Steadily
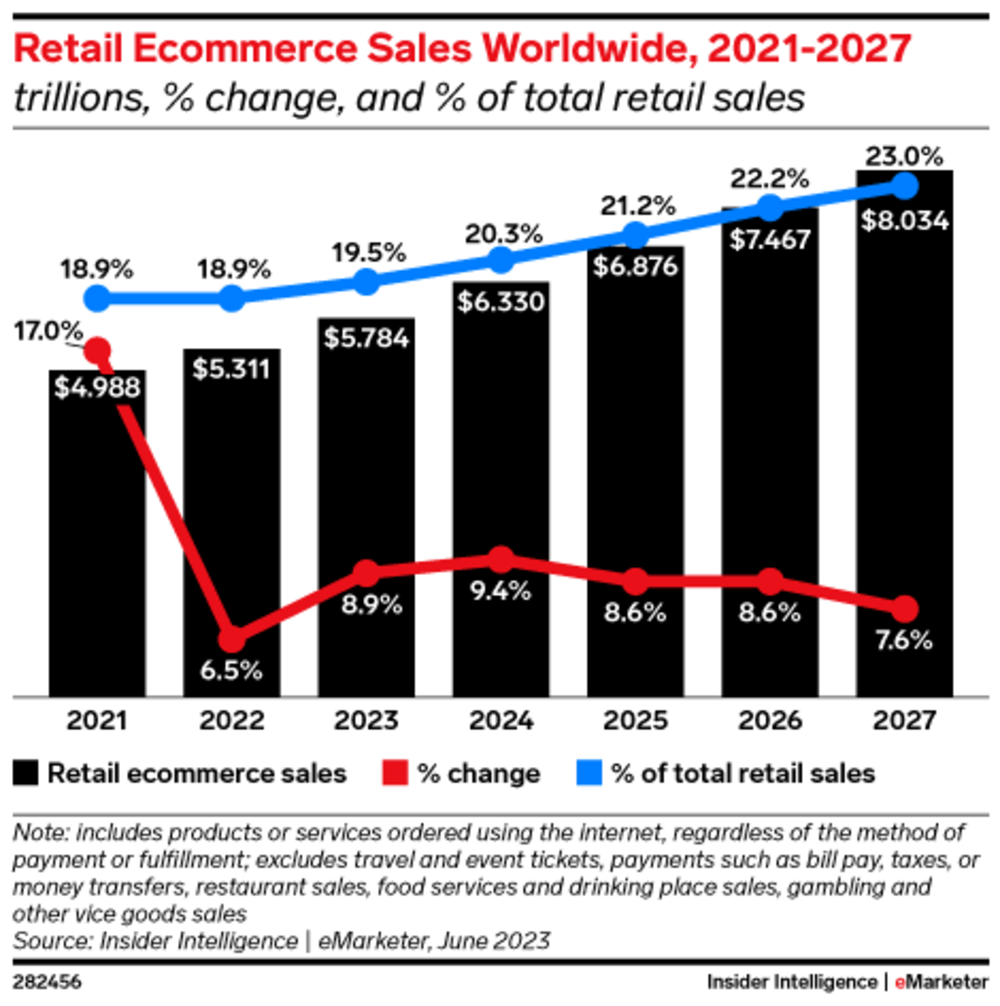
The global eCommerce scene has been evolving at a staggering pace, and the data from recent years paint a clear picture of the growth and the expected trajectory in the industry. According to Worldwide eCommerce Forecast 2023 by Insider Intelligence, eCommerce retail 2023 witnesses an upward trend with an 8.9% increment from the previous year, reaching $5.784 trillion in Sales. This trend will continue in the following years and steadily cross the $8 trillion mark in 2027. This illustrates the increasing volume of money being spent in the digital marketplace and represents a vast field of opportunity for businesses operating online.
More than that, the report also highlights many interesting factors in different areas of the global eCommerce industry in 2023. Here are the key takeaways:
- The Rising Share of Online Retail: In 2023, eCommerce is expected to account for 19.5% of retail sales, with projections increasing to 22.2% by 2026. This shift indicates a sustained consumer preference for online shopping, moving away from traditional brick-and-mortar establishments.
- Dominant Players and Marketplaces: Amazon remains the leader in eCommerce sales, holding 37.8% of the market. This dominance is a testament to the platform’s comprehensive approach to eCommerce, serving as a one-stop shop for a multitude of product categories. Walmart, eBay, and AliExpress also continue to be significant players, dominating in terms of site visits and consumer preference.
- Growing Social Media Commerce: Social media platforms are emerging as vital sales channels, with $992 billion spent through social commerce in 2020. This trend is forecasted to surge to $2.9 trillion by 2026. Almost 97 million Americans shop via social media, with millennials leading the charge.
- Mobile eCommerce (mCommerce): This section is also experiencing a sharp incline. With 91% of users making purchases via smartphones, mCommerce sales are expected to form 6% of all retail sales in 2023. By 2025, mobile commerce sales are predicted to hit the $710 billion mark, underscoring the importance of mobile-optimized shopping experiences.
- Challenges and Consumer Behavior: eCommerce businesses must navigate challenges such as cart abandonment, which stands at 84% on mobile devices and 72% on desktops. A significant reason for cart abandonment includes additional costs like shipping and taxes. Also, slow shipping and the obligation to create an account can deter customers. Addressing these pain points is essential for capitalizing on the growing eCommerce market.
- Global Penetration and Local Dynamics: eCommerce is not just a Western phenomenon; it has penetrated global markets, with China seeing nearly 50% of its online shoppers purchasing via social networks. The eCommerce evolution is also reflected in local dynamics, such as in the U.S., where 16.4% of retail purchases are expected to happen online in 2023.
The Growth of Online Stores and Leading Products Categories Purchased
The Growth of Online Stores in 2023
As seen in previous data, the online retail landscape has seen remarkable expansion, with over 26.5 million eCommerce sites globally in 2023, as reported by Blogging Wizard. This represents a 1.1% YoY growth, indicating a slower pace compared to the explosive 39% growth in 2022 and the exceptional 204% surge in 2021, primarily attributed to the COVID-19 pandemic. The digital shift propelled many businesses to establish an online presence.
From 2019 to 2023, the total number of eCommerce sites more than doubled, showcasing the rapid evolution of the global digital economy. While 2022 maintained substantial growth, the 1.1% YoY increase in 2023 may signal market stabilization post the surge induced by the pandemic.
Interestingly, eCommerce retail purchases are anticipated to escalate from 14.1% to 22% in 2023. This underscores the continued momentum of online shopping. To capitalize on this trend, businesses are advised to prioritize optimizing their eCommerce sites for an enhanced user experience. Despite the slower YoY growth, the absolute number of eCommerce sites remains considerable, emphasizing the enduring significance of online commerce in the contemporary market.
Leading Products Categories Purchased in 2023
In 2023, the global eCommerce landscape showcases consistent preferences in online shopping across various regions. The top product categories purchased online worldwide, according to Simtech Development include:
- Electronics and Gadgets: This category encompasses smartphones, laptops, tablets, and other electronic devices. Those devices have significant demand in North America, Europe, and Asia. Specific markets include the United States, China, Japan, and several European countries.
- Fashion and Apparel: Clothing, shoes, accessories, and fashion-related items are consistently popular among online shoppers. It is particularly popular in fashion-forward regions such as Europe (e.g., France, Italy), North America (United States), and Asia (South Korea, Japan).
- Home and Kitchen Appliances: Products like kitchen gadgets, home decor items, and appliances find a substantial market in the digital space. This is commonly sought after in developed economies with a focus on home improvement. Popular markets include North America, Europe, and countries like Australia.
- Health and Beauty: Skincare products, cosmetics, supplements, and personal care items continue to experience high demand online. Notable in beauty-conscious markets such as the United States, South Korea, and various European countries.
- Toys and Games: Children’s toys, video games, and board games are frequently purchased through online platforms. Universally popular, especially in regions with a high percentage of families and children like the United States, Europe, and Asia.
- Books and Media: Physical books, e-books, music, movies, and other forms of media maintain a strong presence in the digital marketplace. It is strongly in demand in the United States and the United Kingdom. Also popular in countries with a strong literary and entertainment culture.
- Furniture and Home Decor: Online furniture shops offer a diverse range of products for home furnishing and decor. It’s particularly popular in developed economies with a focus on home aesthetics. Markets include North America, Europe, and countries with a burgeoning middle class like China.
- Sports and Fitness: Exercise equipment, sports gear, and fitness accessories remain popular eCommerce products. It has strong demand in health-conscious regions and countries like the United States, Western Europe, and fitness-focused markets in Asia.
- Baby and Maternity: Products for infants, toddlers, and expecting mothers, including baby gear and maternity clothing, are consistently sought after. It’s especially popular in regions with a high birth rate, which includes the United States, Europe, and Asia.
- Groceries and Food: Online grocery shopping experienced significant growth, especially during the COVID-19 pandemic, reflecting a shift in consumer behavior. It’s especially popular in urban areas, notable in countries like the United States, the United Kingdom, and various Asian markets.
While these categories exhibit global trends, it’s important to recognize that regional preferences and market dynamics may influence the popularity of specific products.
The Domination of Amazon in The Global eCommerce Market
Amazon has firmly established itself as the dominant force in the global eCommerce market. As of 2023, it commands a remarkable share, accumulating over half of the industry’s net sales. The company’s net worth at the start of the year stood at a staggering $847 billion, a testament to its financial strength, according to Sellersprite. Furthermore, financial experts predict that Amazon is on track to achieve a global net revenue of $1.1 trillion by the end of 2023, setting the stage for record-breaking retail sales and net revenue growth.
Amazon’s dominance in the global eCommerce market is underpinned by its logistical prowess, customer-centric approach, value-added services, and diverse revenue streams. As eCommerce continues to grow, Amazon is poised to maintain and expand its position as the industry leader, offering significant opportunities for businesses and sellers to thrive on its platform.
eCommerce Sales by Country and Region in 2023
In 2023, the landscape of global eCommerce sales is marked by robust growth, with different regions exhibiting varying rates of increase.
Here is the list of country and region ranking by eCommerce sales according to Oberlo’s global eCommerce sales growth (2023–2027) report.
China maintains its position as the largest eCommerce market
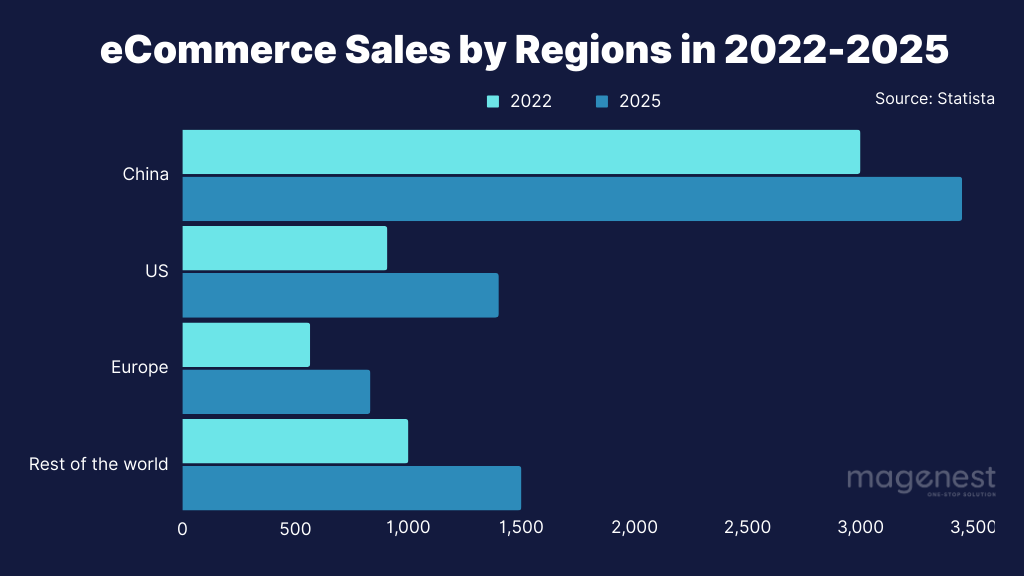
China maintains its lead in the eCommerce space, accounting for more than half of global online retail sales, with a staggering $3 trillion in sales as of 2022. Although its growth is expected to slow down to 15% in the upcoming years, China’s sheer volume of sales remains unmatched.
The United States shows itself as an eCommerce powerhouse
The US follows China, with approximately 218.8 million American consumers anticipated to shop online in 2023, with eCommerce sales forecasted to exceed $940.9 billion for the year, solidifying the U.S. as a powerhouse in the eCommerce sector. Projected increase of 50% in eCommerce sales, the US eCommerce is expected to hit $1.4 trillion by 2025. This indicates a thriving market that is set to grow significantly from the $907.9 billion recorded in 2022.
Europe is one of the top 3 most important eCommerce markets
Europe also shows a positive trajectory, with an anticipated growth rate of 47% in its eCommerce market. The United Kingdom stands out as the third-largest eCommerce market globally, expecting to see more than $143.8 billion in online sales in 2023.
The rest of the world also witnessed an upward trend
In comparison to the top 3, the rest of the world is forecast to witness an average of 52% surge in online sales, climbing from just over $1 trillion in 2022 to $1.5 trillion in 2025. This includes 2 following major regions:
- Asia (besides China): The Asian eCommerce market, excluding China, is also a significant growth driver within the global digital economy. Singapore, with its 25.5% growth rate in sales in 2022, along with Japan and South Korea, which collectively account for 5.5% of global retail eCommerce sales, highlight the region’s accelerating adoption of online retail. This trio and China, representative of the broader Asian market, contributed to the dynamism and innovation of the sector, bolstering the region’s reputation as a burgeoning eCommerce hub.
- Latin America: Latin American countries, including regional players such as Brazil, Argentina, and Mexico have collectively realized a 22.4% increase, raising their eCommerce sales to $104 billion in 2022. More than that, Brazil has the highest CAGR at 14.63%, followed by Argentina at 14.61%, and Mexico at 13.67%. This shows the region’s promising potential for eCommerce expansion.
eCommerce Platform Statistics
The landscape of online commerce is ever-evolving. Understanding the preferences and choices of eCommerce platforms is crucial for businesses seeking to establish and grow their digital presence. As we delve into the eCommerce Platform Statistics 2023 by Buitwith, we uncover valuable insights into the market’s dynamics and trends.
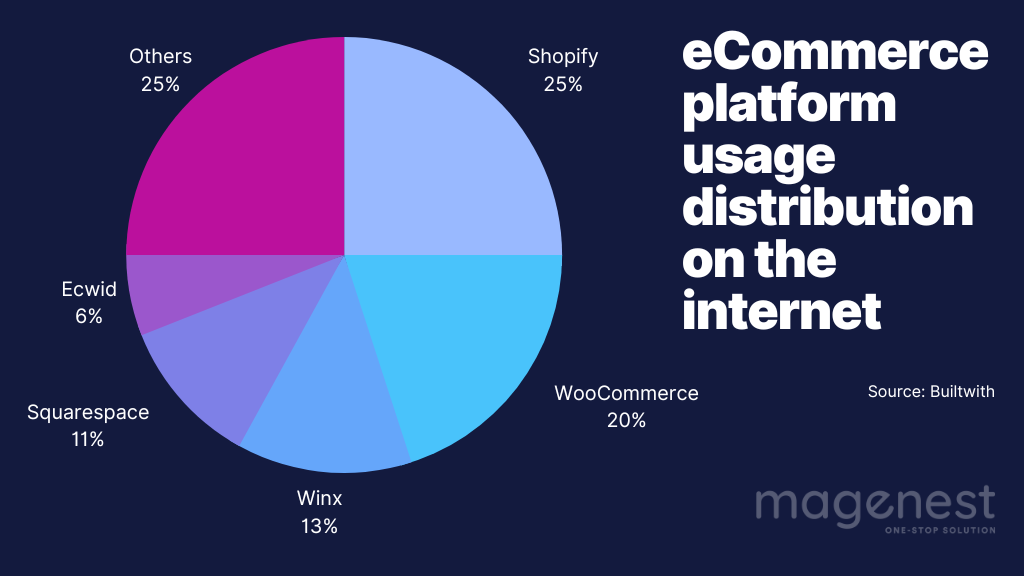
The chart provides insights into the most widely used eCommerce platforms across a vast sample of over 26.2 million tracked websites. It offers a glimpse into the platforms that hold a commanding presence in the eCommerce landscape, revealing the favored selections of countless online retailers.
Shopify Is the Leading Platform
Shopify emerges as the most popular eCommerce platform, with a commanding 25% share of all eCommerce sites. This translates to over 6.5 million eCommerce stores choosing Shopify, approximately a quarter of the market. This platform is especially favored among the top-performing stores: 19% of the top 10,000 eCommerce sites, based on traffic, are powered by Shopify. Its appeal is reflected in its adoption by leading companies like Vogue, Sears Appliances, SpaceX, Vanity Fair, Inquirer, Simon and Schuster, and Glamour, marking it as a preferred solution for both burgeoning and established eCommerce businesses.

In the United States, it powers a remarkable 61.39% of live eCommerce sites, showcasing its stronghold in one of the world’s largest eCommerce markets. Even among the highest echelons of online retailers, Shopify maintains a significant presence, with 3.38% of the top 10,000 websites picking this platform to power their online stores. This data underscores Shopify’s versatility, adaptability, and appeal, making it a preferred choice for both emerging and established eCommerce businesses. From industry giants to smaller enterprises, the numbers tell a compelling story of Shopify’s integral role in shaping the global online shopping experience.
WooCommerce Is Not Far Behind
WooCommerce stands as a formidable eCommerce platform, firmly establishing its presence in the digital commerce landscape. With a 20% market share among eCommerce platforms, it commands the attention of online retailers worldwide. This impressive market share equates to powering over 5.2 million eCommerce websites, making WooCommerce a preferred choice for businesses seeking robust online selling capabilities.
It’s worth noting that this data specifically relates to websites utilizing WooCommerce checkout. However, when considering websites that incorporate various WooCommerce elements, even if they don’t exclusively use WooCommerce checkout, the tally surpasses a staggering 6.5 million websites. This widespread adoption underscores WooCommerce’s adaptability and appeal across a diverse array of online retail ventures. Among the top 1 million eCommerce websites, WooCommerce maintains a strong presence with an 18.2% market share, securing its position as the second most popular choice, just behind Shopify. This data highlights WooCommerce’s versatility, capable of catering to both emerging and established online businesses, across different scales and industries.
WooCommerce’s association with WordPress, the leading content management system (CMS) globally, further solidifies its significance in the eCommerce realm. WordPress itself holds an impressive 64.3% market share among all CMSs, making it the go-to platform for website creation and management. It is interesting to note that WordPress powers a substantial 43% of the entire web, with over 35 million websites. Of these, more than 10% incorporate WooCommerce to bolster their online selling capabilities.
The vibrant ecosystem surrounding WordPress extends seamlessly to WooCommerce, with its thriving marketplace of themes, plugins, services, and third-party tools. Despite being a sub-platform of WordPress, WooCommerce independently stands as one of the top eCommerce solutions. These WooCommerce market share statistics reflect its exceptional growth and enduring impact in shaping the global online shopping experience. In a digital age characterized by rapid transformation, WooCommerce remains a trusted and reliable choice for businesses seeking to thrive in the eCommerce arena. Its remarkable journey from inception to its current standing, underscored by the impressive statistics presented, attests to its resilience and adaptability in the ever-evolving world of online retail.
Wix
Wix or Wix store holds a notable position, with 13% of eCommerce stores using its solutions. The platform offers a user-friendly experience with various eCommerce capabilities, catering to a wide range of online merchants seeking ease of use and an all-in-one package for establishing their online presence. In 2022, Wix reported a total revenue of $1.388 billion, representing substantial growth in its financial performance. Moreover, in the second quarter of 2023 alone, Wix achieved $390 million in revenue, indicating a 13% year-over-year growth compared to the same period in 2022. At this pace, Wix is poised to surpass $1.5 billion in yearly revenue by the end of 2023. As of June 30, 2023, Wix boasts an impressive 254 million registered users, although only a fraction of these users, approximately 6.1 million, are premium subscribers. Furthermore, Wix’s revenue is well-distributed globally, with 63% of total revenue originating from North America, followed by Europe (23%), Latin America (4%), and the remaining 11% from Asia and other regions.
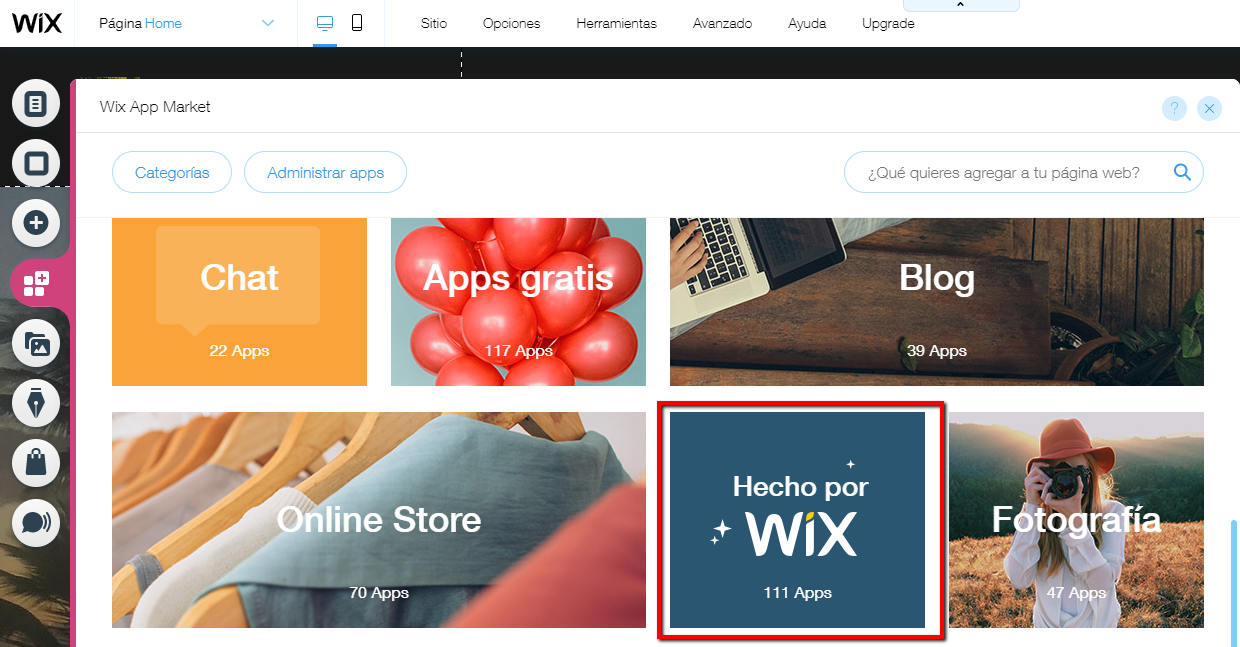
This accomplishment is attributable to Wix being a user-friendly and complimentary website-building platform. It empowers individuals and businesses to effortlessly create professional websites that are adaptable to any device. Offering an intuitive editor with drag-and-drop technology, Wix provides creative flexibility for users of all levels. Users can start for free and upgrade to Premium Plans for added benefits. Wix’s diverse range of custom designs, templates, and an App Market with over 250 professional solutions cater to various website needs. It enables businesses to accept payments securely through Wix Payments and offers multiple payment options. With its accessible, feature-rich, and cost-effective approach, Wix stands as a top choice for those seeking a robust and user-friendly website creation and business growth solution.
Squarespace
Squarespace, an influential player in the eCommerce market, boasts an 11% share and stands out for its visually appealing design options and user-friendly interface. With 4% of the top 1 million websites relying on Squarespace, it has established itself as a favored choice among a diverse range of eCommerce businesses. The United States plays a significant role in its user base, accounting for 70.7% and hosting over 213,000 Squarespace stores. Notably, Squarespace has exhibited remarkable growth, witnessing a 6.4% quarterly increase and a substantial 28% annual expansion in store numbers during the first quarter of 2023 compared to 2017.

According to Mycodelesswebsite’s 2023 report, Squarespace serves 3.79 million users, primarily on personal plans, while powering 2,916,770 websites across the internet. Its financial trajectory has been noteworthy, with total revenue reaching $621.15 million in 2020, marking a 26% YoY increase in 2021 to $207.4 million. As of May 11, 2023, Squarespace boasts an annual revenue run rate of $754.2 million. Despite its remarkable performance, only 10 of the top 1,000 websites have adopted Squarespace, indicating a growing but relatively modest, 0.7% increase in market share over the last decade. With its strengths in design, support, and mobile apps, Squarespace continues to make significant strides in the eCommerce platform landscape, although areas like website editor usability and page speed optimization require attention and improvement.
Magento Usage Statistics 2023
Magento continues to be a robust and versatile eCommerce platform in 2023. It powers 8% of the top 1 million online stores, making it a preferred choice for businesses with complex eCommerce needs. Magento’s usage statistics are impressive, with 0.6% of all websites on the internet and 7% of eCommerce websites relying on the platform. It experiences around 5,000 daily downloads, reflecting a 300% increase since 2018, and supports over 239,000 live websites, with 38% using Magento 2.
Geographically, Magento is prominent in the United States and enjoys popularity in the United Kingdom, Netherlands, Germany, and Brazil. The platform excels in the fashion industry and is widely adopted by businesses in fashion, furniture, shoes, bags, groceries, food, and apparel verticals. In 2021, Magento’s gross merchandise value (GMV) was estimated at a substantial $225 billion. Magento offers a comprehensive range of extensions and themes for customization. Its official marketplace hosts over 3,700 Magento extensions, with 309 adopting a subscription-based pricing model. Additionally, there are six theme options available as alternatives to the default Luma theme, and numerous third-party extensions and themes from vendors further enhance customization options.
Other eCommerce Platforms Statistics
Besides those 5 major platforms, the rest of the eCommerce websites are using many other platforms like Ecwid, OpenCart, Weebly, and more. Although these platforms may seem to have fewer users when standing independently, together they take up around 30-35% of all websites, which is roughly over 8 million. Having a small number of clients also means they are more willing to try new technologies. This means they are more likely to be able to adapt to new trends and able to reach out to niche markets.
The statistics from virtocommerce stated that by the end of 2023, there will be a significant shift in the B2B selling landscape, with 65% of sellers operating fully online and offering comprehensive online purchasing options. This transition represents a fundamental change in the way business is conducted, with a strong focus on digital platforms. The key point here is that half of these sellers have invested in developing their own eCommerce platforms with specific features that fit their industries. This trend presents a unique opportunity for smaller eCommerce platforms, especially those with a willingness to adopt new technologies. These platforms can leverage this trend to capture a niche market by offering innovative and tailored solutions that cater specifically to the needs of these B2B sellers.
For smaller eCommerce platforms, this situation presents a strategic opportunity to differentiate themselves in a crowded market. By focusing on innovative technologies, personalized services, and specialized features that address the specific needs of B2B sellers, these platforms can position themselves as attractive alternatives to larger, more generic eCommerce solutions.
eCommerce Consumer Statistics
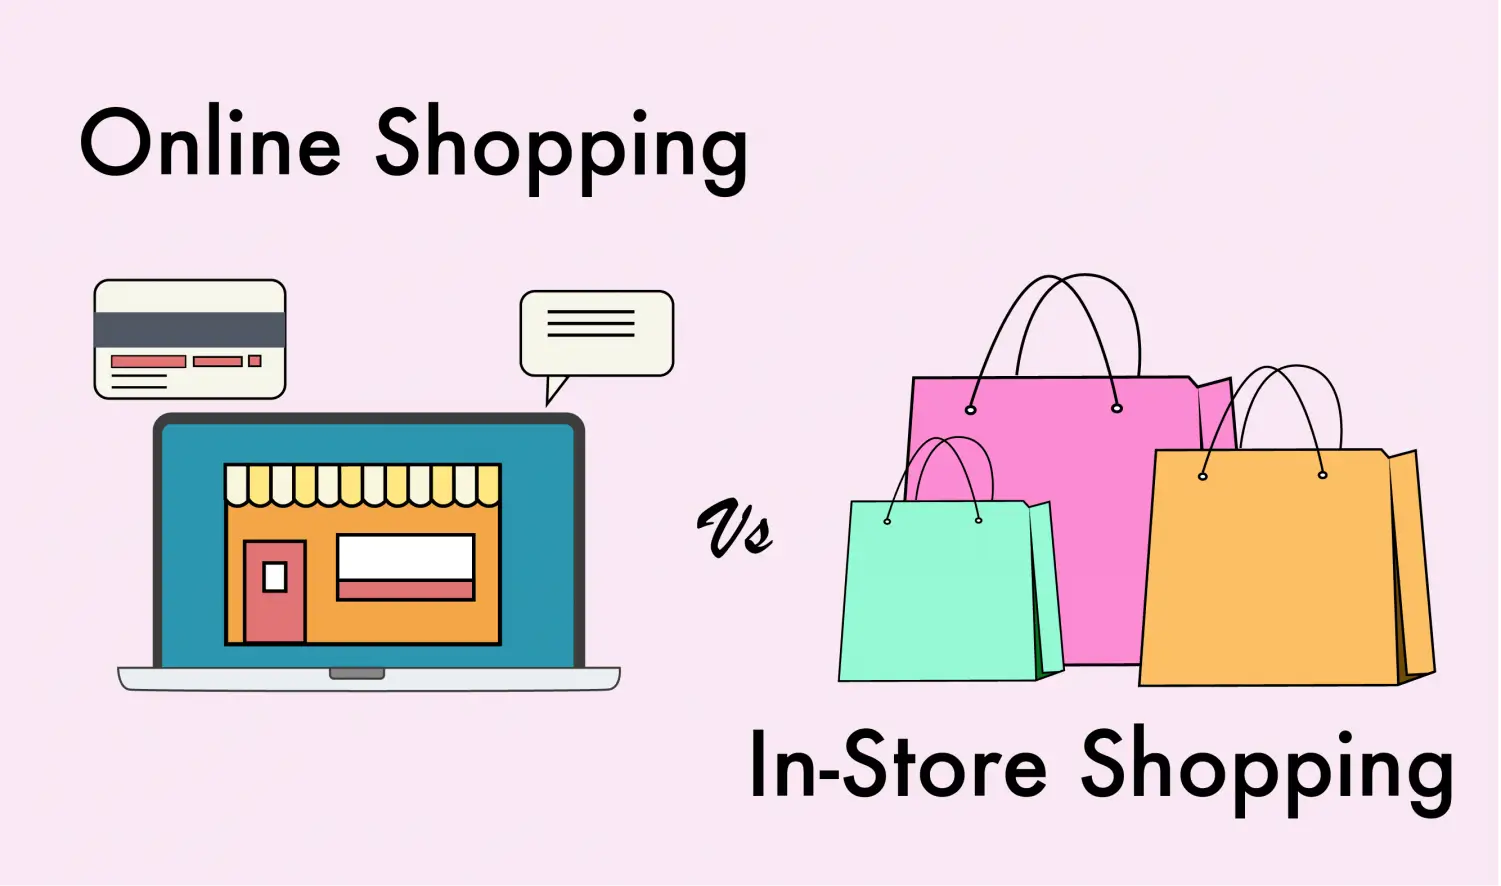
Online Shopping and In-store Shopping
Forbes’s 38 eCommerce Statistics Of 2023 showed that Online shopping behavior in 2023 reflects a global perspective, with 57% of online shoppers reporting that they shop internationally, highlighting the transformative potential of eCommerce to reach a global audience. However, certain factors influence online shopping behavior, including the common reason for cart abandonment, with 48% of shoppers citing additional costs like shipping, taxes, and fees as a deterrent. Additionally, 24% of shoppers abandon their carts when asked to create an account, emphasizing the importance of guest checkout options. Slow shipping is another significant factor, causing 22% of shoppers to drop out of the shopping session. It’s crucial for eCommerce businesses to streamline shipping processes to meet customer expectations.
Furthermore, online shopping is firmly integrated into consumers’ routines, with 79% of shoppers making online purchases at least once a month. However, cart abandonment rates vary across devices, with an 84% abandonment rate on mobile devices and 72% on desktops. Retail is evolving in the post-pandemic world, with NRF forecasting retail sales growth between 4% and 6% in 2023, totaling between $5.13 trillion and $5.23 trillion. Despite the growth of eCommerce, 80% of all shopping still occurs in physical stores, emphasizing the continued importance of an integrated shopping experience that combines both online and in-store channels.
As eCommerce and in-store retail complement each other, retailers are adopting strategies like ship-from-store and Buy online, pick up in-store (BOPIS) to enhance customer experiences. While eCommerce remains a significant driver of growth, accounting for around 15% of all retail sales, it works in synergy with physical stores, creating a halo effect that boosts web traffic and in-store visits. Retail employment is a crucial part of the economy, with 42 million jobs supported by the retail industry, but there’s a need to modernize data collection methods to accurately represent the industry’s workforce.
Overall, the retail industry continues to evolve, driven by changes in fulfillment, purchasing behavior, and technology adoption, with experts reevaluating traditional metrics and approaches to measure success in this dynamic landscape.
Online Shoppers’ Volume and Demographics
In 2023, the online shopping landscape is characterized by significant volume and diverse demographics. Adobe, in their Top eCeommerce statistics for 2023 report, has estimated that 2.64 billion consumers worldwide are expected to have made at least one online purchase, underlining the extensive reach of eCommerce on a global scale.
Online Shoppers’ statistics by gender
In the realm of online shopping, men exhibit notable trends when compared to women. A survey shows that men outspend women by 28% in online purchases, with 24% of men shopping online daily, in contrast to 17% of women. However, overall, 72% of women and 68% of men regularly shop online.
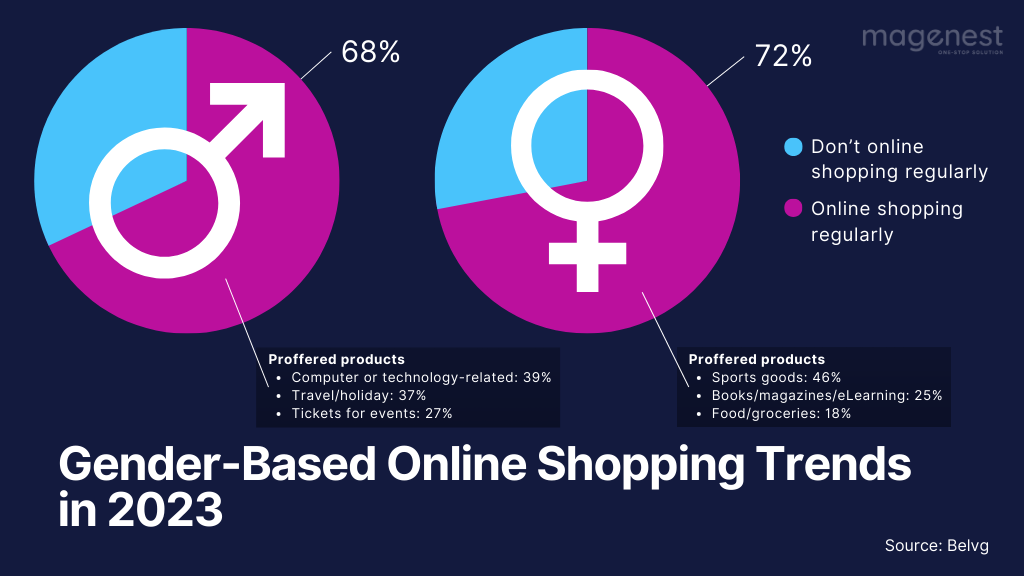
Diverging preferences in product categories also emerge between genders. Men tend to gravitate towards heavier-duty items such as furniture and computers. Conversely, women often opt for more everyday essentials, including groceries and clothing. Delving into the specifics of preferred online products, women showcase a higher inclination for purchasing clothes or sports goods (46%), books/magazines/e-learning materials (25%), and food/groceries (18%). Meanwhile, men exhibit a stronger preference for computer or technology-related products (39%), travel/holiday recommendations (37%), and tickets for events (27%). These gender-specific insights into online shopping behaviors illuminate the distinct shopping patterns and preferences of men and women in the digital marketplace.
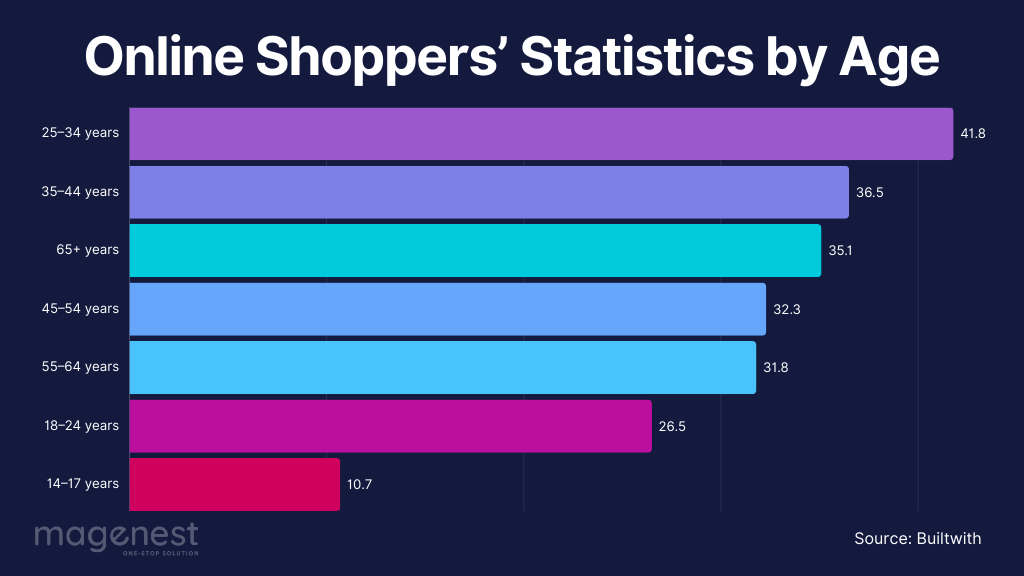
Online Shoppers’ Statistics by Age and Generation
Online shopping has become a widespread phenomenon, attracting a diverse range of consumers across various age groups and generations. This has been demonstrated by Optinmonster’s Online Shopping Statistics 2023. The appeal of eCommerce is particularly strong among Millennials and Gen-Xs, as evidenced by the fact that 67% of Millennials and 56% of Gen-Xs express a preference for online shopping. However, it’s not just about generational differences; age also plays a crucial role in shaping online shopping trends. One striking observation is that the largest group of online shoppers falls within the 25 to 34-year-old age category, with a staggering 41.8 million individuals actively making online purchases. This age group is followed closely by those aged 35 to 44 years and individuals aged 65 years and above, demonstrating that online shopping transcends generational boundaries and is embraced by both younger and older consumers alike.
Intriguingly, the influence of Generation Z, the cohort born after 1997, is on the rise. It is estimated that Gen Z will possess a formidable buying power of $44 billion. Currently, 93% of parents acknowledge that their Gen Z children have a significant influence on household spending decisions. Notably, Gen Z stands out as a generation that is twice as likely to shop on mobile devices compared to their Millennial counterparts since they have early access to smartphones and 95% of this generation own one. These insights underscore the substantial volume of online shoppers, their diverse demographics, and evolving shopping behaviors. Businesses looking to succeed in the eCommerce landscape must pay close attention to these demographic nuances and shopping preferences, as they hold the key to crafting effective online strategies that cater to the needs and expectations of their target audiences.
Average Online Shopping Cart Abandonment Rate
Shopping cart abandonment is a significant challenge for eCommerce businesses, with unexpected extra costs being the leading cause, accounting for 48% of all abandoned carts. Consumers strongly dislike encountering surprise fees just as they’re ready to make a purchase, and this can lead to a high average abandonment rate of 69.99%. For eCommerce companies, this translates to potential losses of billions of dollars each year.
In addition to unexpected costs, other factors contribute to cart abandonment, including slow delivery, which affects 22% of shoppers, and the requirement to create an account before the checkout process, is cited by 24% of users. However, there are effective strategies to combat cart abandonment.
- Sending follow-up emails to users who abandoned their carts is one such method, with an impressive 45% open rate and 21% click-through rate, offering a significant opportunity to recover potential sales.
- Another successful approach is offering discounts on items left in the cart, as 54% of shoppers are more likely to complete their purchase when they see a discount applied to their abandoned items.
- More than that, most online shoppers, accounting for 90%, are willing to accept longer delivery times if it means they can benefit from free shipping offered by the vendor.
By addressing these key factors, eCommerce businesses can take proactive steps to reduce cart abandonment and improve their conversion rates.
Online Shoppers Consult Reviews Before Making a Purchase
Consulting reviews online is a noteworthy consumer behavior, distinguishing the digital shopping experience from in-store purchases. The way of online reviews is substantial, Online Shopping 2023 Data Analysis & Market Share report by Finances Online showed that:
- A remarkable 91% of consumers aged 18 to 34 place as much trust in online reviews as they do in recommendations from family and friends.
- Furthermore, for 78% of online shoppers, the presence of product reviews on an eCommerce platform holds paramount importance, underscoring the pivotal role that reviews play in shaping purchasing decisions.
- Before making a buying choice, a significant 93% of consumers prioritize reading reviews, underlining their reliance on this form of social proof.
- The impact of reviews extends to social media, influencing the shopping decisions of 23% of individuals.
Online reviews empower customers to share their buying experiences, offering a form of social proof that wields considerable influence, whether through positive endorsements or critical feedback. These statistics underscore the profound significance of online reviews and their role in shaping consumer behavior and purchase preferences.
Leveraging Shoppers’ Good Intentions for Sustainable eCommerce
A gap exists between shoppers’ intentions and the realities of online shopping, primarily due to the behind-the-scenes aspects of eCommerce being hidden from view. Retailers have the opportunity to promote more sustainable behaviors by providing consumers with the information they need to align their shopping choices with their values.
Statistics reveal that 20% of items purchased online end up being returned, resulting in five billion pounds or $6.3 billion of returned merchandise in U.S. landfills annually. Factors such as packaging, delivery mishaps, and expedited orders can contribute to the carbon footprint of eCommerce. Consumers are motivated to make eco-friendly choices, but they require guidance to understand the environmental impact of their decisions. Retailers can play a role in educating their customers by offering transparency regarding the environmental implications of checkout choices. Information about packaging alternatives, the handling of returns, and options for order consolidation can empower shoppers to make responsible purchases.
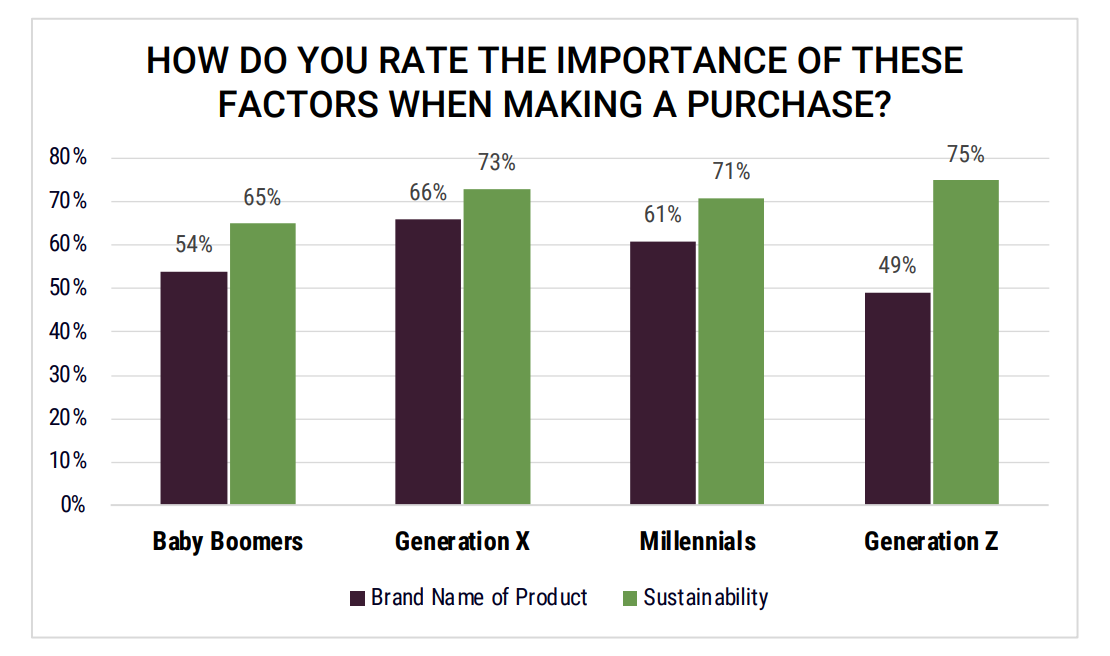
Prioritizing sustainability requires concerted effort, but businesses have the potential to drive significant change. Leading companies can set examples and inspire others to adjust their practices. The report The State of Consumer Spending: Gen Z Influencing All Generations to Make Sustainability-First Purchase Decisions by First Insight has informed us that approximately 51% of customers consciously consider sustainability and eco-friendliness when making purchasing decisions. Consumer awareness is on the rise, with reports indicating that 82% of shoppers desire brands to embrace sustainability and people-first principles, with Gen Z taking the lead. More than 65% of all shoppers from 3 generations being surveyed said that they prioritize sustainability over brand names. This research also underscores the importance of retailers and brands committing to sustainability practices to align with the evolving expectations of consumers and secure a sustainable future for the retail industry.
- One effective starting point for businesses is to apply more concise options for customers like providing eco-friendly packaging or low carbon emission shipping options.
- A company can also improve its products, replacing ingredients with more sustainable or even recycled ones, reducing product waste, implementing renewable energy sources, etc.
- Furthermore, companies can invest in green technology, creating opportunities to promote the widespread adoption of sustainable retail options.
Mobile Commerce Statistics
mCommerce is quickly becoming a dominant force in the digital retail world thanks to the technological improvement of smartphones. Mobile commerce, or mCommerce, involves shopping through mobile devices like smartphones and is set to revolutionize the way consumers engage with retailers. In 2023, retail mCommerce sales are projected to constitute a remarkable 43.4% of total retail eCommerce sales, a notable increase from 41.8% in 2022. This shift has forced retailers to make shopping on mobile devices more user-friendly and accessible. Let’s find out more about the mCommerce statistics and what information you can gain from it.
Mobile User’s Online Traffic Statistics
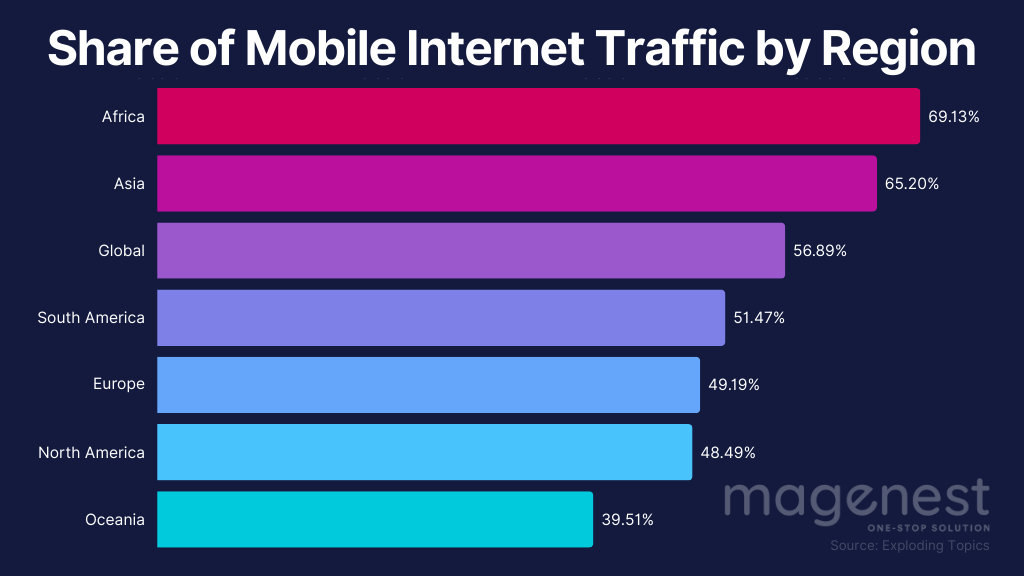
Mobile devices now play a central role in online traffic, with their contribution soaring to 56.2% of all website traffic, a significant leap from 31.16% in 2015, according to Internet Traffic from Mobile Devices (2023) report. This trend underscores the increasing reliance on mobile devices for internet access, as highlighted by the fact that a staggering 92.3% of internet users now use mobile phones to go online. This is in stark contrast to the 65.6% who use laptops or desktops, indicating a shift towards more portable, always-connected modes of internet access.
The global distribution of mobile internet traffic varies significantly across regions. Africa leads with a 69.13% share of mobile internet traffic, which is 12.24% above the global average. Asia follows closely with 65.2%, surpassing the global average by 8.31%. Other regions like South America, Europe, North America, and Oceania trail behind, with their shares of mobile internet traffic falling below the global average.
This shift towards mobile internet usage is even more pronounced in certain countries, particularly in Asia. The 11 countries leading the charge in mobile shopping, all located in Asia, have a higher proportion of mobile shoppers than the global average. Indonesia tops this list with 79.1% mobile shoppers, followed by Thailand (74.2%), the Philippines (69.6%), and other Asian countries, including Malaysia, Saudi Arabia, China, Taiwan, Vietnam, South Korea, India, and Singapore.
These statistics not only demonstrate the increasing importance of mobile devices in internet usage but also highlight the pivotal role that mCommerce is playing and will continue to play in the global retail landscape.
Retail mCommerce Total Sales
The trajectory of mCommerce has been remarkable in recent years, as highlighted by Statista’s Market Insights. In 2023, mobile eCommerce sales hit an impressive $2.2 trillion, accounting for 60% of all eCommerce sales worldwide. This marks a significant shift in consumer shopping habits, as just five years prior, in 2018, mobile eCommerce constituted only 56% of all eCommerce.

The growth of mobile eCommerce is not just in its share of the total eCommerce market but also in absolute numbers. The sector is expanding rapidly, with Statista analysts projecting that by 2027, mobile eCommerce sales will reach a staggering $3.4 trillion. This forecast is a substantial increase from the $982 billion recorded in 2018, indicating a rapid and expansive growth trajectory for mCommerce.
This surge in mobile eCommerce is driven by changing consumer behaviors. People are spending more time on their mobile devices, such as phones and tablets, and are increasingly valuing the convenience these devices offer for shopping. The ability to make purchases on the go or from the comfort of one’s home has made mobile eCommerce an increasingly attractive option for consumers. As a result, mCommerce is not just capturing a larger share of the eCommerce market but is also growing in absolute terms, indicating a trend that is likely to continue.
Mobile Users Trend: Comparing Product/Services’ Prices & Qualities to Maximize Spending Power
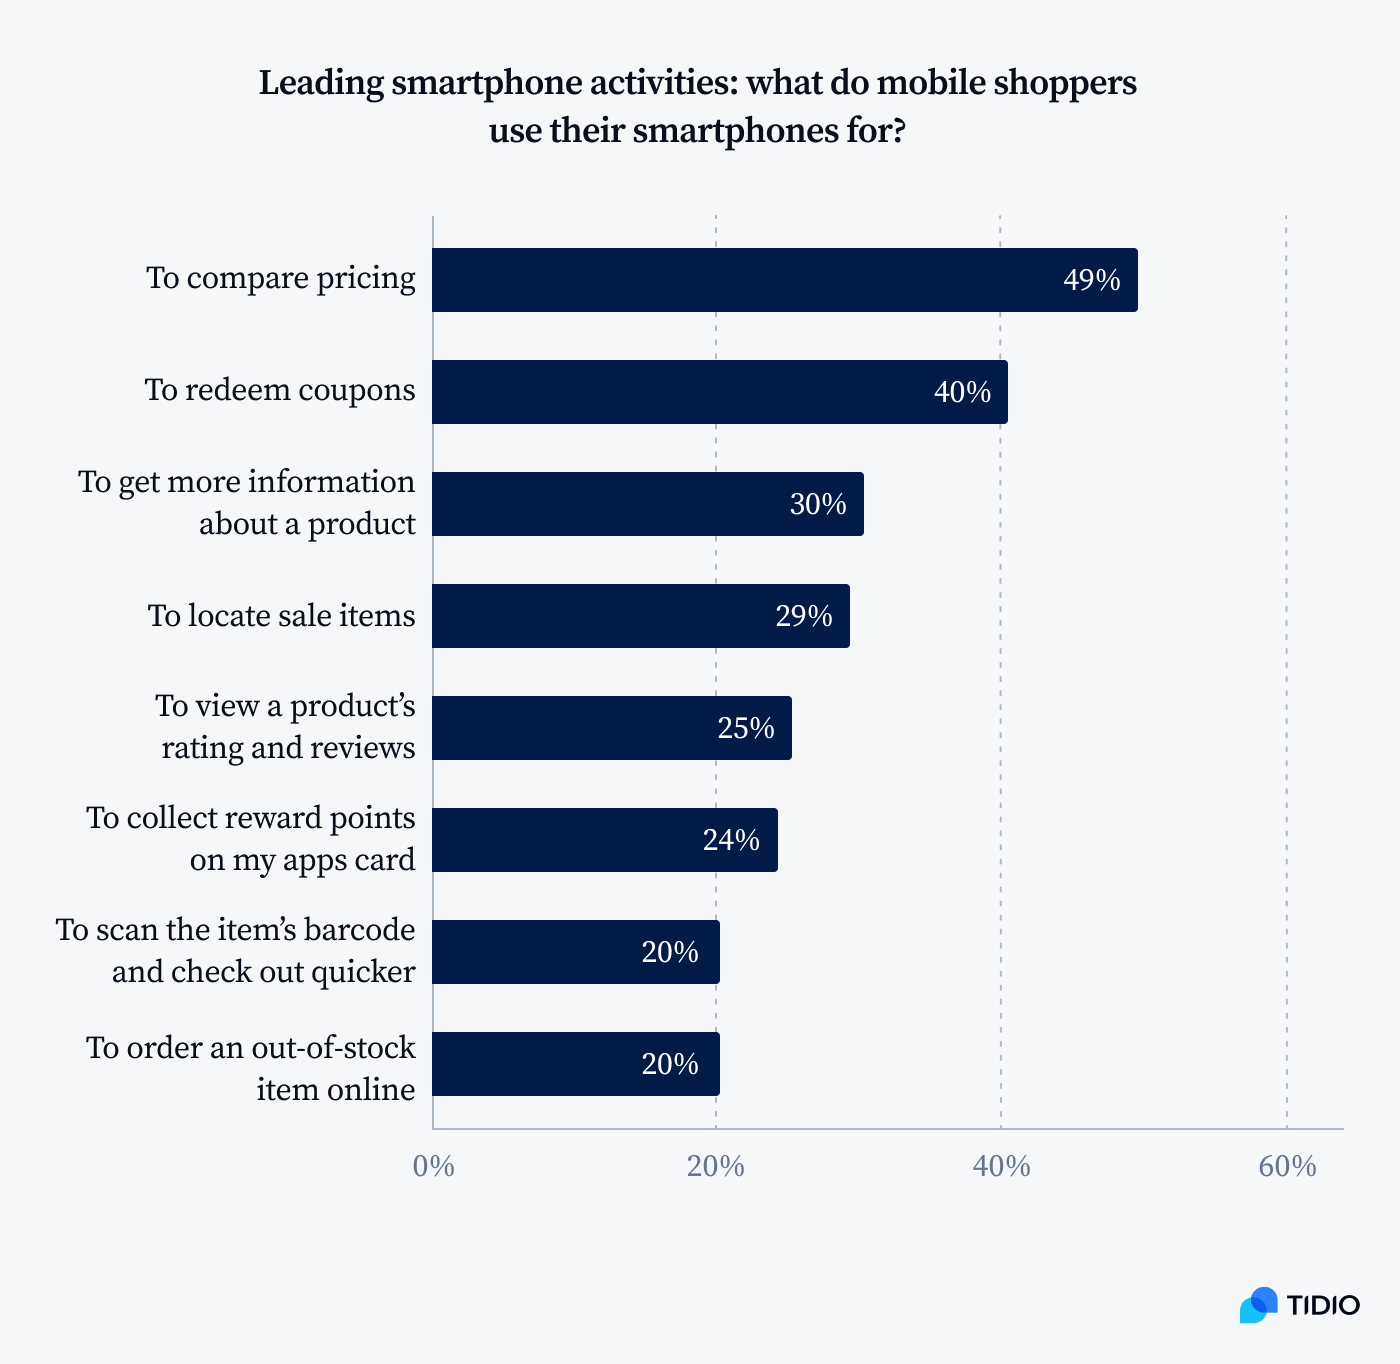
The trend of comparing prices and maximizing purchase value is on the rise among mobile shoppers. According to Criteo’s The Rise of Savvy Shoppers Report, about half (49%) of mobile users frequently compare the pricing of products or services on their smartphones, indicating a growing emphasis on securing the best deals. Mobile shoppers are also keen on redeeming mobile coupons (40% of users) and gathering more information about products they’re interested in (30% of users).
Consumers are also adopting forward-thinking strategies to make the most of their spending power. Globally, around 40% of shoppers are buying gifts for future holidays and birthdays in advance to preempt rising prices. And 64% of consumers worldwide are purchasing essential items in bulk to maximize value for their money.
Inflation is further accelerating these trends, driving shoppers to seek better offers and value online.
- A significant portion of consumers (71%) is spending more time online to find the best offers before making a purchase,
- 65% of consumers discover products at better prices online compared to physical stores.
- Additionally, there has been a 28% increase in online shoppers buying from five or more retailers compared to a year ago.
While shoppers are focused on saving money, product quality remains the top priority, even ahead of free shipping and discounts/coupons. Factors influencing purchase decisions include product quality (91%), free shipping (90%), and discounts/coupons (84%). Consumers are also looking for more than just discounts from brands, with eco-friendliness (57%), alignment with brand values (63%), and loyalty points (65%) playing significant roles in their purchase decisions.
Bottom line, online merchants should prioritize delivering a seamless mobile experience, as the first impression often occurs on a smartphone. As consumers buy from multiple retailers, advertisers have opportunities to secure loyal buyers and enhance customer lifetime value by engaging in customer retention strategies. Advertisers should target relevant audiences actively in the market and ready to buy. Finally, it’s best to understand consumer preferences and continually improve your products accordingly.
Voice Shopping Is Still Very Much in the Trend
Voice shopping is undeniably on the rise, and the statistics for 2023 by Synup highlight its growing prominence in the digital landscape.
- Currently, there are a staggering 4.2 billion active voice assistant devices globally, a number projected to double to 8.4 billion units by 2024.
- Google App searches illustrate this trend, with 27% of them being conducted through voice, amounting to 1 billion voice searches each month via mobile and voice-activated devices.
- Moreover, around 80% of voice searches are expected to become conversational by 2024, marking a significant shift from traditional search methods thanks to the rise of AI and ML technology.
- Voice search is a substantial driver of revenue, contributing over $2 billion by 2022. Integrating voice search optimization into your strategy can lead to increased sales and revenue. Looking ahead, voice search is set to continue its ascent, with a projected $40 billion in sales by 2024.
However, consumers still have some concerns about voice shopping for various reasons. PWC’s voice assistant research showed that trust is one significant barrier with 46% of respondents saying they don’t trust voice assistants to correctly interpret and process shopping orders, while 45% said they don’t trust or feel comfortable sending payment through a voice assistant. That resulted in only 24% of respondents saying they would use voice shopping.
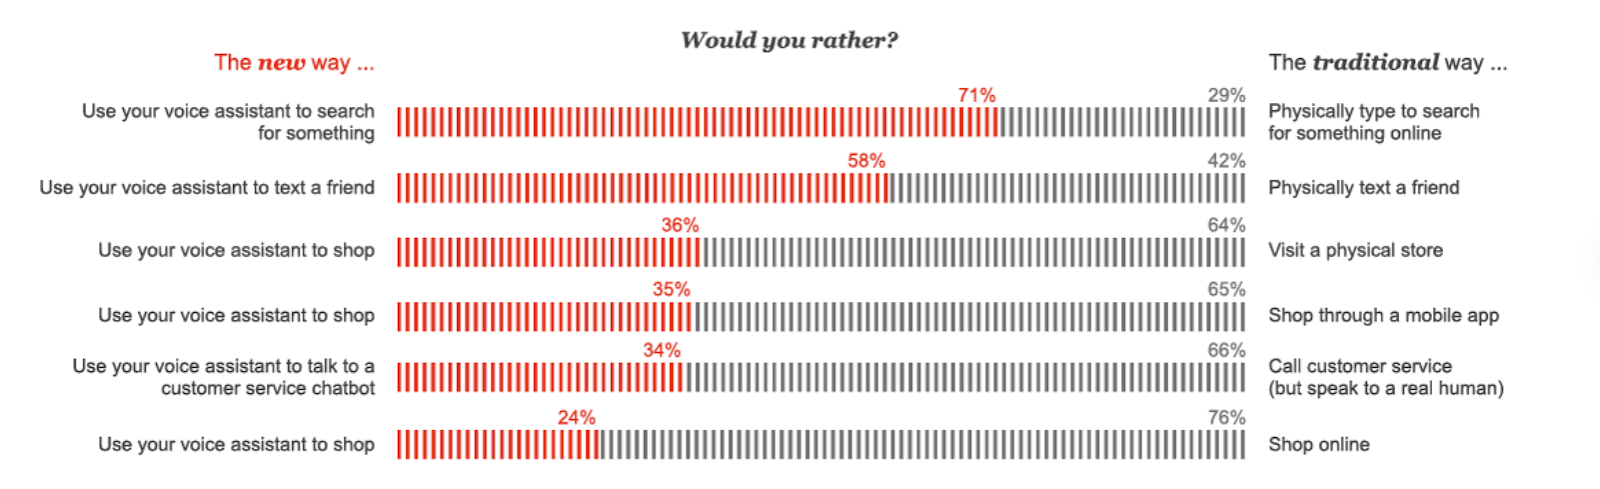
In contrast, the surge in voice search’s popularity can be attributed to its convenience, speed, and technological advancements. Users prefer voice search for quick tasks, with 71% favoring voice assistants for efficient searches. The accuracy of voice recognition, which is exemplified by Google’s 95% word accuracy rate in 2020, has also contributed to user trust. Hands-free operation is another driver, as over 53% of smart speaker owners rely on voice commands for a seamless, hands-free experience. With more than 4 billion digital voice assistants in use worldwide, voice search has become a ubiquitous part of our daily lives. Looking ahead, the voice commerce landscape is set to expand significantly, marking a substantial shift in consumer behavior and online retail strategies. But instead of placing voice commerce later on the sales funnel, merchants should prioritize making it an early stage by optimizing SEO, making your products and services show up in their voice search results.
QR Code Payment Is Preferred Due to Its Speed and Convenience
Customer satisfaction in the eCommerce landscape is significantly influenced by several factors, which include emphasizing the ease of checkout (81%) and seeking a range of payment choices (71%). This highlights the critical role of the checkout process in shaping customer experiences, urging merchants to fine-tune this aspect of their offerings. One of the solutions – QR code payment has become a preferred choice among consumers due to its speed and convenience. This trend, like many other eCommerce trends, is led by Millennials and Gen Z customers, with QR code payment users expected to exceed 2.2 billion by 2025, constituting 29% of all mobile phone users worldwide.
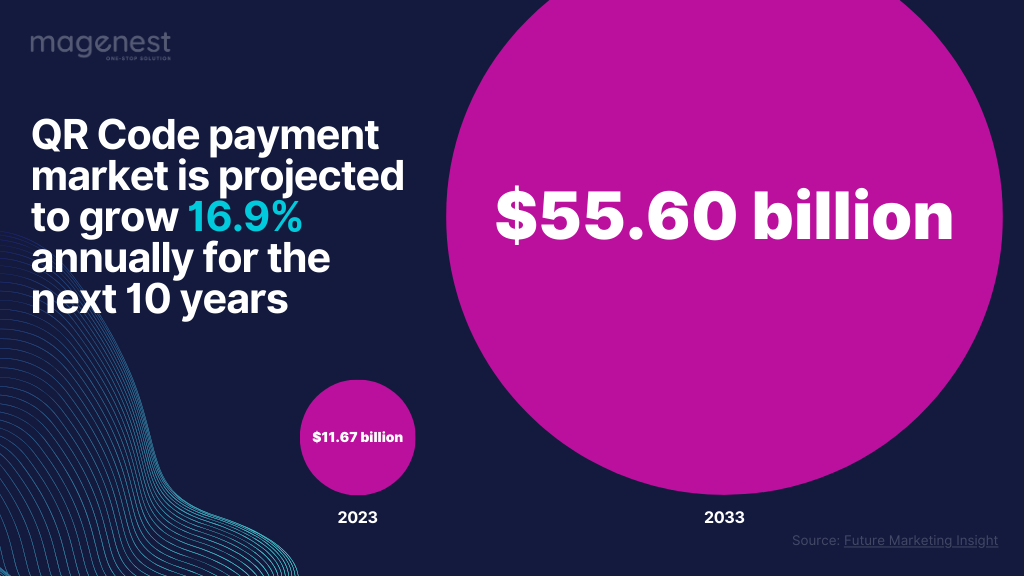
Looking ahead to the QR code payment market, a recent study by Future Marketing Insight paints a promising picture. The market is expected to surpass $11.67 billion in 2023, with analysts projecting a remarkable 4.8X growth, reaching over $ 55.60 billion by 2033. This expansion is supported by a compound annual growth rate (CAGR) of 16.9% from 2023 to 2033. The surge in the QR code payment sector can be attributed to various factors, including the widespread adoption of smartphones, the simplicity and convenience of QR code payments, coupled with the ease of storing payment information on mobile devices. More than that, government support for QR code payments to promote financial inclusion, the proliferation of dynamic and offline QR codes, and ongoing innovations in QR code technology have made it an attractive choice for consumers. To cater to the increasing number of customers opting for mobile-based payments, businesses are increasingly integrating QR code payment systems into their operations.
AI/ML in mCommerce
Best mCommerce apps in various categories
In the first quarter of 2023, the global app market demonstrated remarkable resilience, showing growth despite economic challenges. Here’s a comprehensive overview of the Applications trends and statistics from Q1 2023 by Data.AI’s insights.
mCommerce’s Consumer Spending and Growth in 2023
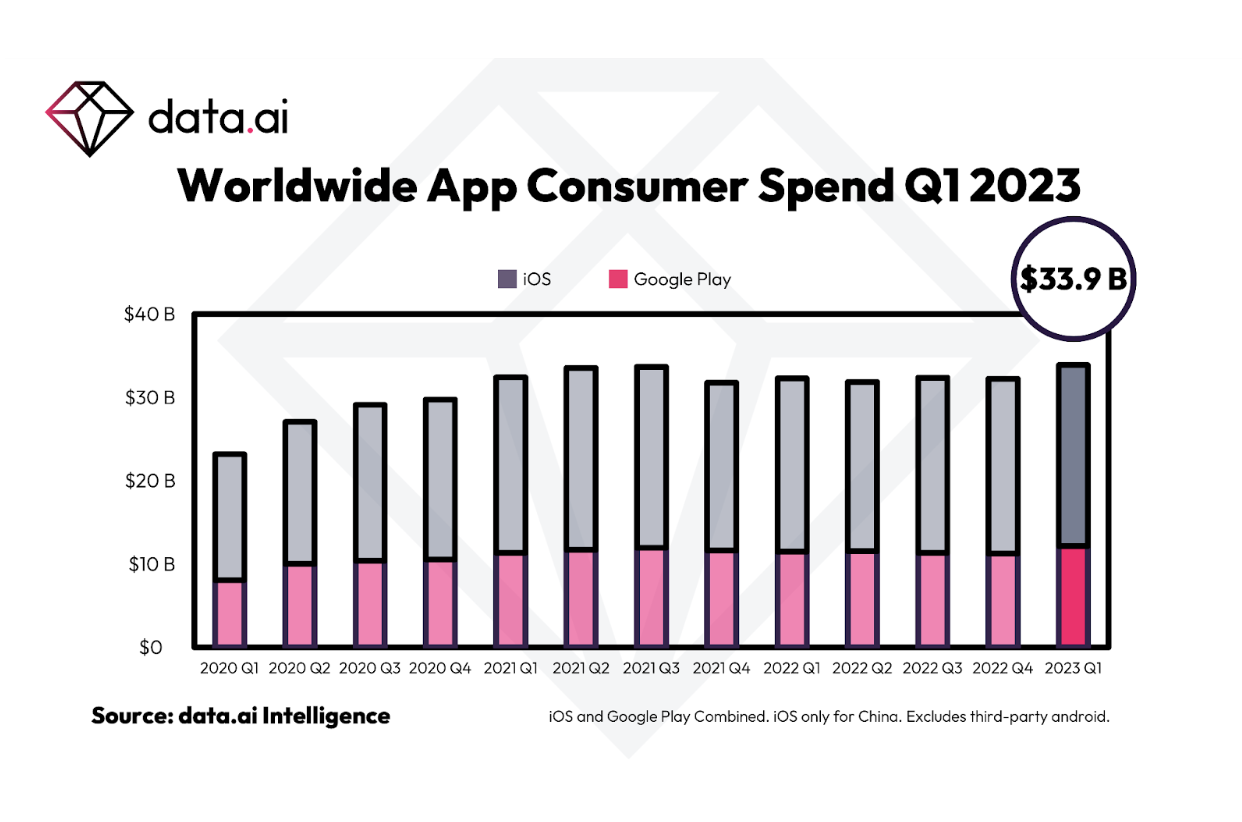
In 2023, the mobile commerce sector experienced a remarkable upswing, with consumer spending in app stores reaching a record high of $33.9 billion in the first quarter. This surge represents a notable increase from the $32.4 billion recorded in Q3 2022 and a marginal elevation from the $33.7 billion seen in Q3 2021.

A closer look at the platforms reveals a distinct spending pattern: iOS users contributed significantly to this growth, spending $21.7 billion, which constitutes 65% of the total app store expenditure. This expenditure marked a 4% year-over-year growth for iOS. Meanwhile, Google Play also saw a substantial increase, with its users spending around $12.2 billion, translating to a 6% growth compared to the previous year. This trend underscores the robust and expanding nature of the mobile commerce market, reflecting a growing consumer confidence and engagement in the digital space.
- Top Categories by Consumer Spend (Google Play): Games, Entertainment, and Social.
- Highest Quarter-over-Quarter Growth Categories: Video Players and Editors (21%), House & Home (21%), and Health & Fitness (20%).
- Top Regions for Consumer Spend: United States, Japan, and South Korea.
mCommerce’s Download Trends and Regional Insights
In 2023’s first quarter, the app market witnessed an impressive volume of downloads, reaching a total of 38.2 billion. This figure places Q1 2023 as the second-highest quarter ever in terms of app downloads. Breaking this down by platform, iOS experienced a significant 12% year-over-year growth with approximately 9.1 billion installs. On the other hand, Google Play also saw an increase, albeit more modest, with a 1% growth resulting in 29.1 billion installs.
Looking at the global landscape, India and Brazil emerged as the leading markets in terms of download volume, indicating their substantial user base and engagement with mobile apps. Specifically on Google Play, Turkey, Russia, and Iraq experienced notable growth, highlighting these regions as emerging markets in the digital app space. In the realm of iOS, China and the United States were the top markets, reflecting their established and sizeable user base. These trends illustrate a dynamic and expanding global app market, with varying growth patterns across different regions and platforms. For download trends, categories that iOS users download the most include Games, Utilities, and Photos & Videos. While Health & Fitness, Navigation, and Catalogs showed the highest percentage growth quarter-over-quarter. With Google Play users, Games, Tools, and Entertainment were downloaded the most. The most significant absolute increase in downloads was seen in Games, Productivity, and Education, while Productivity, Books & Reference, and Education showed the highest quarter-over-quarter growth.
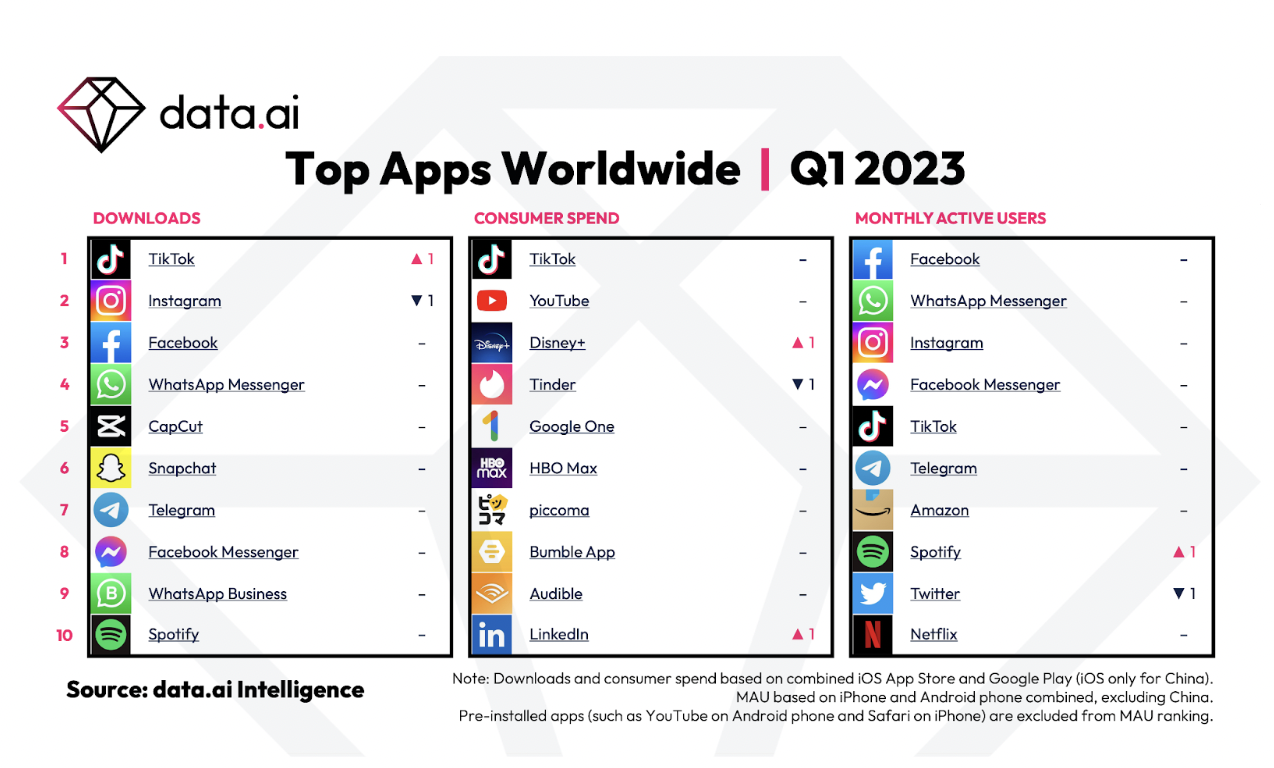
As of the beginning of 2023, TikTok was the most downloaded app, leading the list of the world’s top apps, which primarily includes major social media platforms. This means, that despite Meta’s efforts to compete by promoting Reels on Instagram and Facebook, Instagram is still surpassed in terms of downloads.
Best Designs
The Apple Design Awards of 2023 showcased an array of apps and games that excelled in various categories, celebrating their innovation, design ingenuity, and technical prowess. Here’s a brief introduction to the winners in each category
Inclusivity Winners
APP: Universe – Website Builder by Universe Exploration Company, a tool that democratizes website building with its block-centric design and multi-language support.
GAME: stitch. by Lykke Studios, a relaxing puzzle game that’s accessible to a wide audience, including those with color blindness, low vision, and motion sensitivities.
Delight and Fun Winners
APP: Duolingo by Duolingo, Inc., renowned for its engaging and enjoyable language learning experience, enhanced by a comprehensive redesign.
GAME: Afterplace by Evan Kice, a vintage-styled RPG with a modern twist, offers an expansive world filled with quirky adventures.

Interaction Winners
APP: Flighty by Flighty LLC, a comprehensive and intuitively designed flight tracker and travel planner with extensive Apple ecosystem integration.
GAME: Railbound by Afterburn, a puzzle game with simple mechanics and charming design, suitable for all ages.
Social Impact Winners
APP: Headspace, a meditation and mental health app known for its user-friendly design and diverse range of mindfulness content.
GAME: Endling by HandyGames, a side-scroller game where players navigate environmental challenges, emphasizing empathy and connection.

Visuals and Graphics Winners
APP: Any Distance by Any Distance Inc., a fitness tracker with visually striking data presentations and extensive workout tracking features.
GAME: Resident Evil Village by CAPCOM Co., Ltd., a horror adventure game that sets a new standard in Mac gaming with its stunning graphics and immersive gameplay.
Innovation Winners
APP: SwingVision: A.I. Tennis App by SwingVision Inc., leveraging AI and Apple’s Neural Engine to offer a comprehensive tennis coaching experience.
GAME: MARVEL SNAP by Second Dinner, redefining the collectible card game genre with its innovative gameplay, striking artwork, and engaging mechanics.
These winners exemplify the best in-app and game design, utilizing technologies to create exceptional, engaging, and inclusive user experiences.
eCommerce Marketing Statistics
Personalization Is the Key to eCommerce Marketing
Personalization still holds an important position in the eCommerce industry in 2023. In this highly competitive industry, consumers have a plethora of options at their fingertips, thus forcing businesses to find a way to stand out.
According to the McKinsey report, personalization is among the crucial strategies that have proven to be indispensable for eCommerce success. It is stated that companies that provide a personalized experience to customers can generate 40% more revenue. Applying personalization in marketing campaigns can result in a positive ROI, as reported by 89% of marketers. From the customer perspective, 76% said they would prefer to purchase from a brand that personalizes user experience.
From these statistical reports, we can explain the importance of personalization. 85% of businesses said they deliver a personalized experience to their customers and the global personalization market is projected to reach $2.7 billion by 2027.
One of the primary ways personalization is transforming eCommerce is through recommendation engines. These engines analyze a customer’s browsing and purchase history to suggest products they are likely to be interested in. Whether it’s on the homepage, in email campaigns, or during the checkout process, these recommendations significantly increase the likelihood of conversion. With its effectiveness in delivering personalized experiences, the recommendation engine market size is forecasted to reach $17.30 billion by 2028.
Concern for the balance between personalization and privacy
The willingness of consumers to share personal data for a tailored experience is significant. The survey indicated that about half of the consumers (51%) trust brands to handle their personal data securely and responsibly. On a positive note, over half of consumers (56%) are more likely to become repeat buyers after a personalized experience, marking a 7% increase year-over-year. This positive sign in the market has made 69% of business leaders increase their investment in personalization, despite all the economic challenges. Additionally, 92% of businesses are utilizing AI-driven personalization to drive growth.
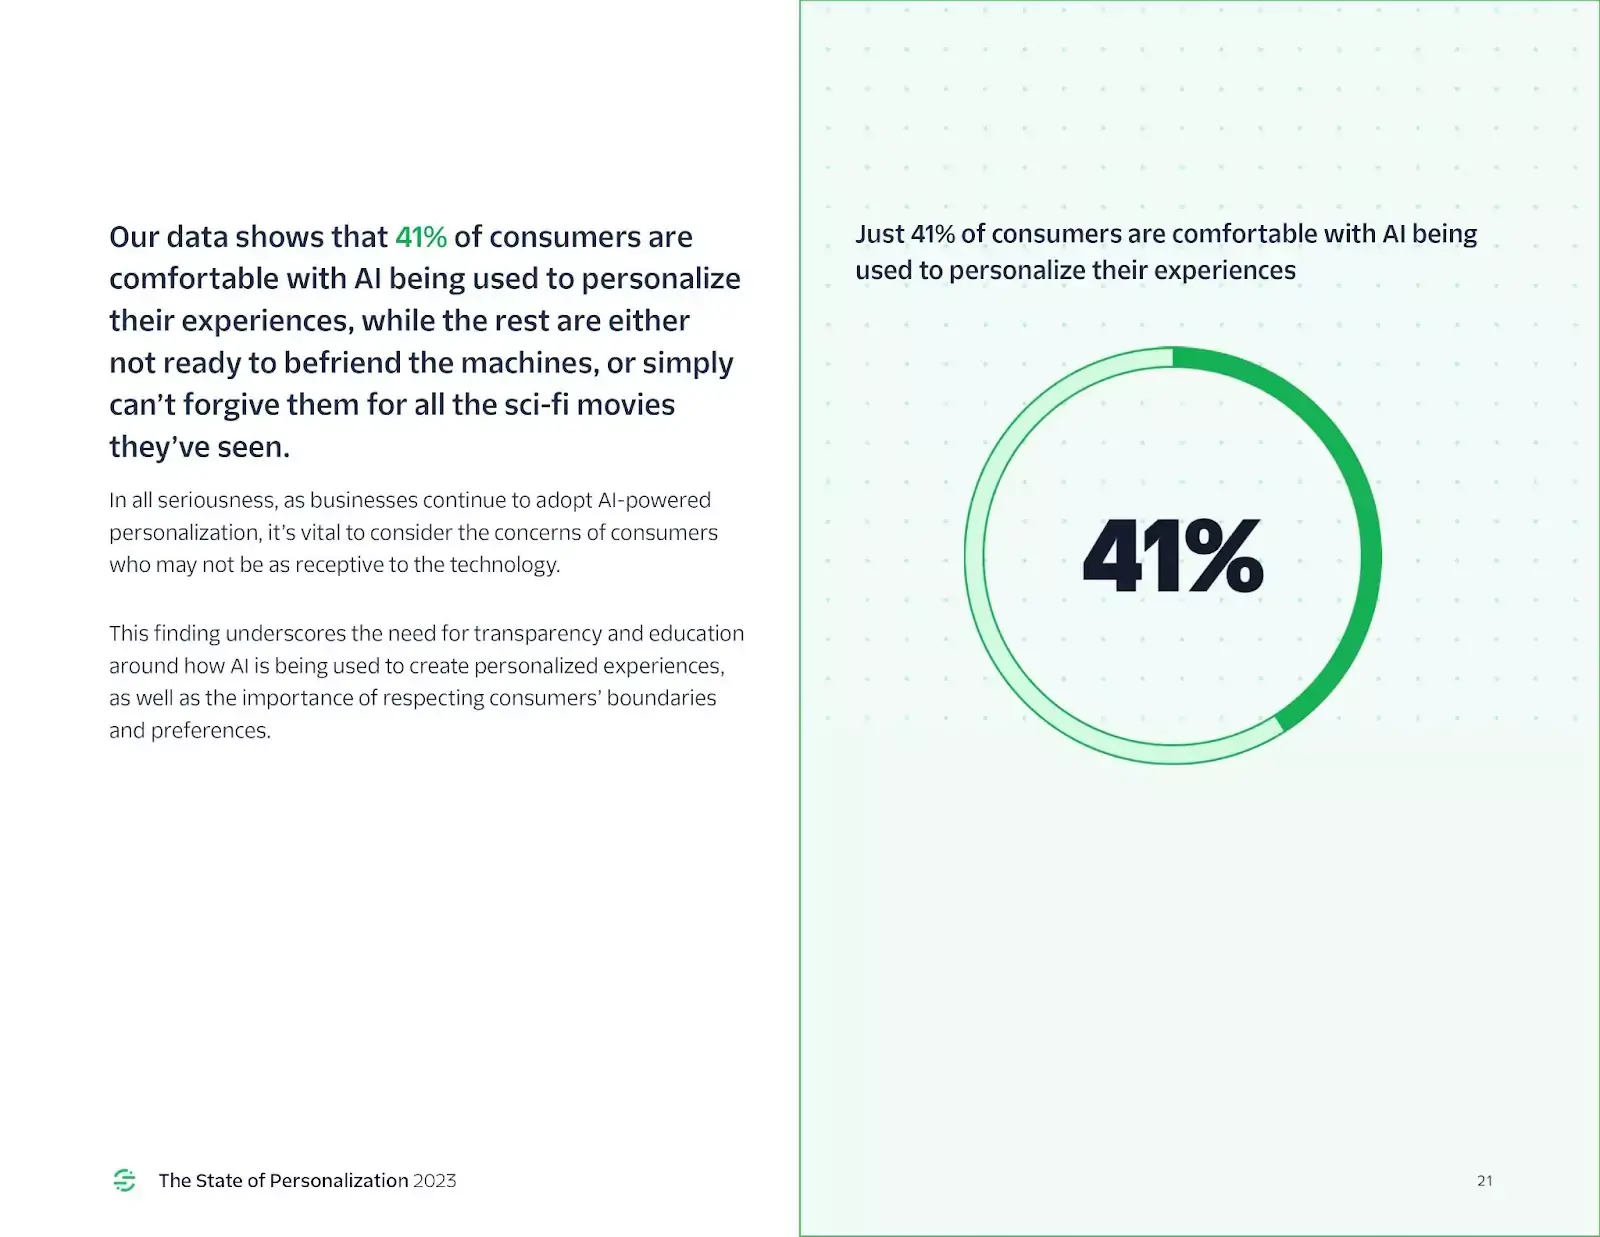
However, the balance between personalization and privacy is becoming a paramount concern. Segment’s data indicates that 23% of consumers are now less comfortable with their personal data being used for such purposes compared to the previous year. This trend is accompanied by mixed feelings towards AI-powered personalization: only 41% of consumers are comfortable with AI personalizing their experiences, while a significant portion remains skeptical, influenced perhaps by portrayals of AI in popular media. This highlights the need for businesses to adopt a transparent approach and educate consumers about how AI is used in personalization, respecting their boundaries and preferences.
The growing consumer awareness about data usage has led to a demand for more control over personal information. This heightened sensitivity is partly driven by the continuous news cycle of data breaches and privacy scandals, which underscores the importance of transparency and trust in customer engagement strategies. For businesses, this presents a challenge as well as an opportunity: addressing consumer concerns and clearly communicating how customer data is used can be pivotal in building trust.
Despite the challenges, the situation isn’t entirely negative. By adopting transparent data collection practices and respecting consumer privacy, businesses have the opportunity to rebuild trust with their customers. However, the gap in market expectations persists, with many consumers feeling that personalized messages still fail to resonate effectively. This suggests that brands need to refine their personalization strategies further, aligning them more closely with consumer expectations and preferences. This balance between leveraging personal data for customization and maintaining user trust is crucial for the successful implementation of personalization in consumer marketing.
Affiliate Marketing Should Be Approached Correctly
Following the rapid growth of digital marketing and eCommerce, affiliate marketing has emerged as a powerful and cost-effective strategy for businesses to expand their reach and boost sales. Especially after the pandemic, where most users increased their online time, the benefits of affiliate marketing are further highlighted.
Statistics in 2023 demonstrated that this practice is deeply embedded in the eCommerce realm. According to Authority Hacker, 81% of brands leverage affiliate programs to boost their brand awareness and drive sales. Within the US market, affiliate marketing is responsible for 16% of all internet orders. For SMEs, 84% of marketers report that affiliate marketing has raised their ROIs by five times. The appeal of affiliate marketing lies in its ability to expand reach, generate leads, and increase sales, all while avoiding the substantial costs associated with hiring a full-scale marketing company.
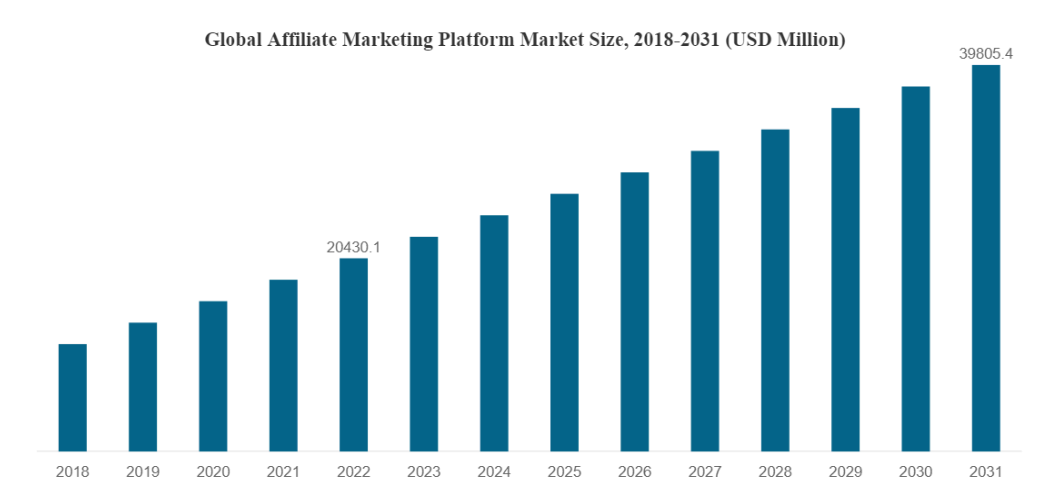
Affiliate marketing has experienced remarkable growth. The market value of affiliate marketing is recorded to exceed $17 billion in 2023, experiencing a substantial increase from $13 billion in 2016. This upward trend is expected to continue, with predictions suggesting that by 2030, the affiliate marketing industry could be worth as much as $40 billion. This demonstrates the rapid and significant growth of affiliate marketing, marking it as a highly promising field.
In terms of strategy, a key finding by Authority Hacker stated that affiliate marketers who select products based on market research earn significantly more (47.16%) than those who choose based on commission rates or personal experiences. High-earning affiliates tend to focus on current trends and audience demand, indicating that a data-driven and trend-focused approach yields the best return on investment. This strategy involves staying updated within one’s niche, identifying trending topics early, and effectively capitalizing on them.
However, with our expertise, these online statistics are not enough to demonstrate all the facets of affiliate marketing. As the core of affiliate marketing is the collaboration between businesses and affiliates, who promote their products or services. Hence, from the business perspective, it is absolutely necessary to put effort into selecting the right affiliates.
It is important to note that the effectiveness of your affiliate marketing campaign does not solely depend on the reputation of your affiliate. You should identify partners whose target audience closely aligns with your own and share the same purpose and vision with your businesses. This alignment ensures that the promotion feels authentic and resonates with the affiliate’s audience. Approaching affiliate marketing correctly can unlock its full potential as a trending and cost-efficient marketing strategy in 2023 and the forthcoming years.
Potential Customers Prefer Stores Offering Live Chat Support
Following the increasing demand of customers for online shopping experiences, live chat is rising as one of the leading eCommerce marketing methods for businesses in today’s world. The year 2023 still sees its domination in the industry with 54% of retailers offering live chat features on their websites.
The adoption of live chat technology is widespread, with over 5.3 million websites using some form of online chat technology. The global live chat software market is expected to reach $1.7 billion by 2030, growing at a Compound Annual Growth Rate (CAGR) of 8.8%. Among the popular live chat software providers are Tawk.to, Facebook Chat Plugin, Zendesk Chat, Tidio, and LiveChat.
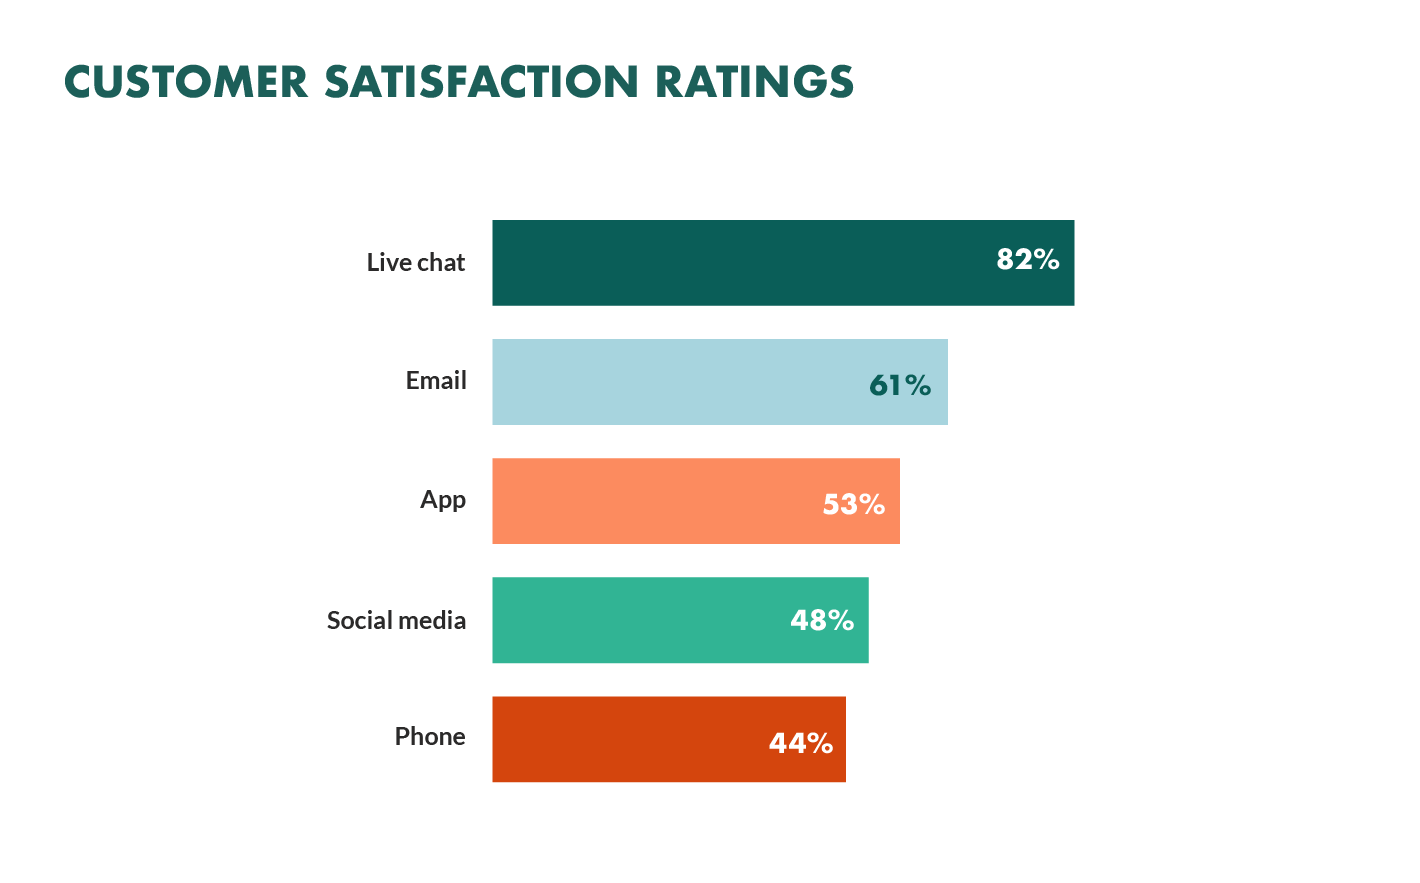
For potential customers, the appeal of live chat support is evident. It offers an immediate and convenient way to seek assistance without the need for phone calls or waiting for email responses. This immediacy is the main reason why 79% of customers reported to prefer to live chat. Other reports also show that 50% of consumers consider having a live person answer the questions in the middle of a purchasing decision as one of the most important features a brand can offer.
Shopify’s Commerce Trends 2023 has stated that over half of shoppers prefer reaching customer service in their channel of choice, often using messaging apps like WhatsApp, Messenger, and Instagram. That means around one billion consumers are now messaging brands on a weekly basis. WhatsApp Business and Telegram are gaining popularity, with WeChat being the top choice in China. Chatbots are becoming essential, with 41% of consumers wanting live chat support while shopping. This has further highlighted the significance of integrating live chat for an enhanced customer experience.
Being a preferred method to customers, 63% of consumers reported that they are more likely to return to a website that offers live chat and 40% of buyers who use live chat are more likely to make online purchases, versus 22% of buyers who had never used. This can result in immense benefits for businesses. As reported by Havard Business School, live chat increases customer retention rates by 5% and grows profits by 25-95%.
In this highly competitive market, customer retention is among the most critical factors for businesses to maintain market share. Live chat is an effective way to deliver instant responses and facilitate faster communication. Therefore, it’s important to invest in providing an excellent live chat experience in your store. Make sure to focus on response time. The average resolution time is no more than 42 seconds for a query to be answered. Keep in mind that creating a personalized chat experience is also important. This can be done by using customer data to provide product recommendations based on their browsing or purchase history.
Majority of Buyers Expect Beneficial Loyalty Programs
Loyalty programs are also widely used and effective eCommerce marketing tools. It is reported that over 83% of customers would likely repeat their purchases if they belong to a loyalty program, while 84% of them would stay loyal to the brand that offers loyalty programs. With the chance to boost customer retention and increase sales, more than 90% of companies are offering some type of loyalty program.
According to McKinsey, the top-performing loyalty programs boost revenue from customers who use them by 15-25% annually. However, with numerous numbers of loyalty programs, creating beneficial programs that can generate high ROI takes a lot of effort.
It is important to note that poor-quality loyalty programs can have counterproductive effects on customer satisfaction. A common mistake that companies tend to overcomplicate or over-restrict the loyalty programs. For example, if you apply gamified loyalty programs but the games are either too complicated or have too-low winning rates, your customers will easily abandon your program. An additional mistake is when companies solely incentivize transactional conduct. This may result in the missing of numerous valuable touchpoints, thereby increasing the probability that customers will lose interest.
There are several ways your businesses can implement to provide a beneficial loyalty program to your customers. Non-transaction rewards are on the rise this year, with 87.5% of loyalty program owners intending to interact with customers in this manner. To illustrate, customers can earn points for writing a product review, filling out surveys, or doing other activities.
It is important to have a checklist for your loyalty programs. According to Business Wire, 53% of customers want loyalty programs to be easy to use, 37% want them to be easy to understand, and 39% tend to focus on great discounts. These are the important contributing factors for a successful loyalty program.
As in a time when personalization holds a critical role, delivering personalized rewards that are tailored to customer preferences and purchase history can be a great game changer. In fact, over 80% of consumers reported that they would patronize brands that offer personalized experiences. Meanwhile, 37% of loyalty program owners say they have already used some form of personalized rewards or offers.
In this fast-paced and technology-driven era, you may also want to consider leveraging technologies like chatbots, AI, VR, and smart devices. 95% of consumers reported to prefer using loyalty programs that use these tools to provide them with exceptional experiences.

Another solution to optimize loyalty programs is using gamification. Companies that implement gamification strategies are found to be 7 times more profitable than those that don’t, according to Tech Report. This is because gamification directly affects user attraction and retention, resulting in higher profits. It can also lead to better customer service and increased customer loyalty, which encourages repeat business and referrals.
More than that, gamifying websites can increase customer loyalty by almost 30%. Leading companies globally have successfully implemented gamification to boost user engagement and loyalty. For example, Verizon Wireless saw a 30% increase in browsing time on its site after implementing gamification. This is also true for brands like Walgreens, eBay, and Threadless. They have reported a 30% rise in engagement and loyalty through gamification tactics. More than that, as highlighted in an HBR article, gamification is a powerful tool that can significantly contribute to customer retention. It has been found to increase customer retention rates by 5% and boost profits by 25% to 95%. This strategy can yield better business results for brands.

The Gamification global market is expected by Mordor Intelligence to reach $57.99 billion in 2023 and reach $58.71 billion by 2028. Gen Z, in particular, is highly engaged with gamification. Statistics from Tapjoy show that 77% of Gen Z individuals play mobile games daily. This demographic’s interest in gamification presents an opportunity for retailers to build brand loyalty and cater to this tech-savvy segment of the population.
Retailers and brands can maximize the benefits of gamification by incorporating progress charts into their platforms. These charts can track user achievements, including past purchases, friend referrals, and updates on new product categories of interest. Balancing wins or rewards within the gamification strategy can further incentivize customers and encourage them to return for more, ultimately driving commercial success when executed effectively.
Email Marketing Is Still Effective in Certain Industries
Despite the rise of other marketing tools, email marketing still holds an important position. In 2023, the number of email users is projected to reach 4,3 million. Following this increasing number, the worldwide email marketing market is expected to be worth 17.9 billion dollars by 2027.
Email marketing is a strategy that offers a great return on investment (ROI), especially in the retail, eCommerce, and consumer goods industries, which witnessed the highest ROI at $45. This strategy also comes with exceptional performance metrics. Email marketing boasts some of the highest open and click-through rates in the digital marketing landscape. Mailchimp benchmarking report reveals that, on average, emails enjoy an open rate of 21.33% and a click-through rate of approximately 3%. This recorded data has proven the effectiveness of email marketing.
The trend towards mobile usage is also reflected in email marketing. 43% of email opens were via mobile devices. Another trend that has a great impact on email marketing is personalization. With 80% of customers likely to purchase from a brand that provides personalized experiences, 9 out of 10 marketers believe that personalization is crucial to overall business strategy, including email.
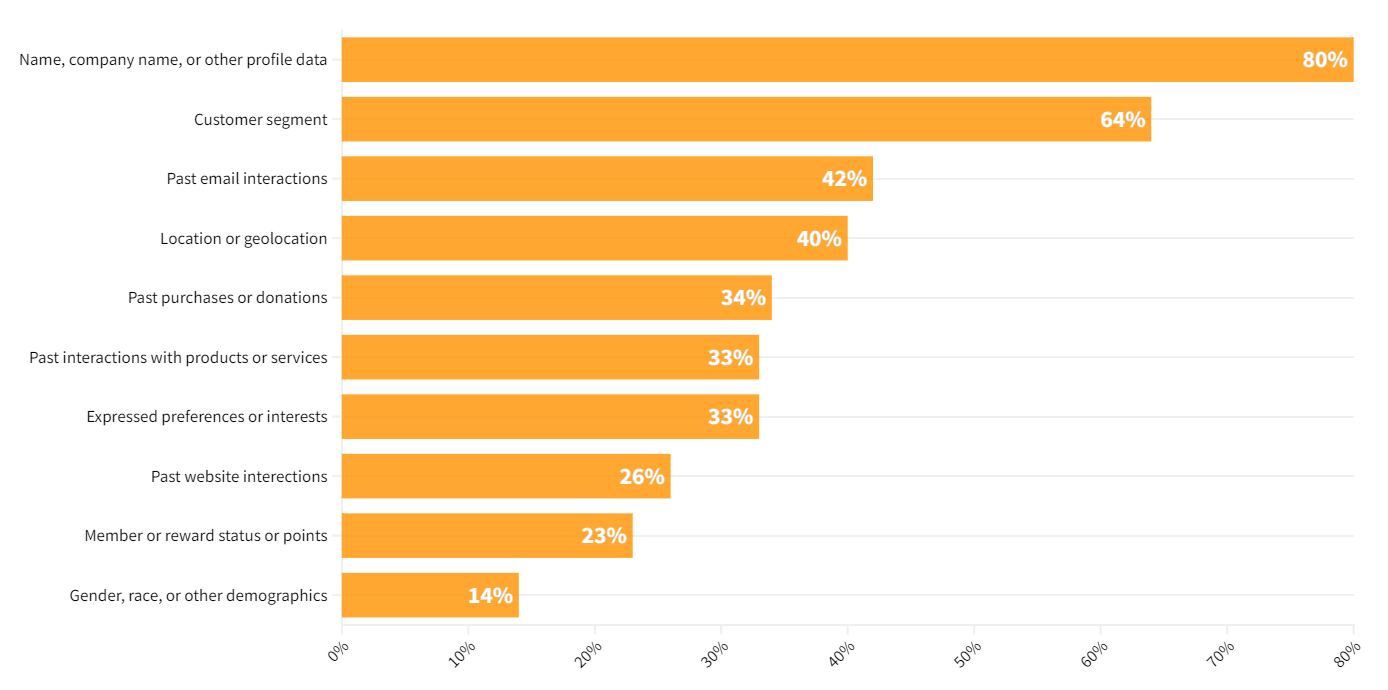
To provide email personalization for your customers, the first and foremost step to take is customer segmentation. In comparison to untargeted campaigns, segmented emails generate 50% more click-throughs and 30% more responses. According to Constant Contact, below are the top 10 elements used to personalize marketing emails.
Based on our expertise, email marketing, despite its effectiveness, is still not a one-size-fits-all solution. Businesses should clearly examine the targeted customers’ behavior, and determine what channels they most interact with, to decide on the best solution that can generate the highest ROI.
Video Marketing now Should Be Short & Sweet
Video continues to be a critical business priority due to its effectiveness as a marketing instrument. According to Wyzowl’s Video Marketing Statistics 2023, 91% of businesses use video as a marketing tool, while 96% of marketers consider video as an important part of the overall marketing strategy. In general, it is reported that 92% of marketers say videos give them a good ROI.
The go-to type of video marketing in 2023
Opportunities for video marketing for the upcoming years are still evident. With the widespread use of the Internet and mobile devices, audiences continue to watch more videos. Wyzowl’s statistics show that the amount of online video watched per week, per person has almost doubled since 2018, reaching 19 hours on average in 2022 as the impact of COVID-19. In 2023, this number has decreased to 17 hours on average.
Video marketing has witnessed a remarkable transformation in recent years. Customers today are inundated with information, and their attention spans have shortened considerably. Moreover, it is recorded that smartphones rank first as the most used devices for streaming online video in 2023. Meanwhile, it is reported that 86% of consumers spent a significant portion of their time on social media watching videos, up from 59% the previous year. This trend emphasizes the importance of optimizing videos for mobile viewing and for vertical screens of those devices as well as creating concise and engaging video content.
In response to this, short video content has proven to lead the way in creating better engagement with customers. Statistics from Yaguara show that 73% of consumers prefer short-form videos to search for products or services. Short-form videos also receive 2.5 times more engagement than long-form videos. It is expected that the ad revenue generated by short-form video will across $10 billion.
Social media platforms, such as Instagram, TikTok, and even YouTube, have popularized the use of short video formats like Stories, Reels, and Shorts. These platforms have conditioned users to expect content that is brief, engaging, and to the point. According to social media experts, videos under 15 seconds have the highest engagement rates on platforms like Instagram. As a result, businesses are aligning their video marketing strategies with the prevailing trends on these platforms to reach wider and more engaged audiences.
Video marketing effectiveness in 2023
According to the report by Motion Cue, key insights for video marketing effectiveness are highlighted as follows:
- Videos pique curiosity, with 84% of viewers visiting a website after watching a video ad about products or services.
- Video is the leading medium for keeping brands top of mind, according to 79% of consumers. Images on social media (75%) also play a significant role in brand recall. Other mediums are Infographics (35%), Blogs (25%), Newsletter (18%), and Brochures/Flyers (12%)
- Explainer videos are highly effective, as 61% of respondents downloaded apps after watching them.
- Marketers have experienced a positive ROI from video marketing, with 96% reporting success and 88% planning to incorporate more videos into their strategies.
This made video marketing one of the go-to media tactics and strategies for marketer.
- 64% of marketers said they wanted to build brand awareness through video marketing
- 60% said that it would increase engagement
- 56% hope it will boost conversion
Remarkably, these objectives have seen high success rates, with awareness campaigns achieving a 100% success rate, engagement campaigns at 96%, and conversion campaigns at 92%.
Preferred Video Platform in 2023
YouTube remains the preferred video hosting platform for sharing videos, with 84% of marketers choosing it as their top choice. It’s also the top platform for watching videos, chosen by the majority, followed by Instagram, Facebook, TikTok, and LinkedIn.

While Instagram Reels is the most preferred platform for short-form video features, with 53% of consumers favoring it. YouTube Shorts and TikTok follow with 33% and 14%, respectively.
The choice between these platforms depends on the target audience, with Instagram Reels appealing more to older generations and TikTok being popular among Gen Z and Gen Alpha.
AI in Video Production in 2023
AI is making strides in video production, assisting with scriptwriting, storyboarding, voiceovers, and video editing. While 36% of marketers have experimented with AI-driven elements in video creation, some ethical concerns remain. Consumer preferences vary, with:
- 49% prefer real humans in videos
- 30% intrigued by AI-generated content
- 21% have no specific preference.
Effective Video Marketing Trends in 2023
Here are the top most effective video marketing trends that brands should consider when implementing video marketing
- Bite-sized video
TikTok made it clear that short videos on social media have a huge appeal. Soon after the Chinese app’s success, other platforms rolled out similar short video features. Instagram came out with Reels and YouTube launched Shorts.
Video stories also became a popular way for people and brands to share quick candid content with viewers. So, which of these short video platforms should you upload content to?
The answer depends on your goals and target audience. If you’re targeting millennials or older generations, then Instagram Reels is a better option. If you’re trying to reach Gen Z or Gen Alpha, then TikTok is the place to be.
- User-generated content (UGC)
The great thing about social media is the fact that businesses can build a sense of community and give their audience space to be creative with their brand. A great example of this is launching campaigns that encourage user-generated content (UGC). Several brands have successfully used this strategy.
The 2019 #Chipotle LidFlip challenge is a great example of this. To date (3 March 2023) the hashtag has 337.6 million views. UGC typically needs a bit of push to lift off. For the lid flip challenge, Chipotle got David Dobrik, a popular influencer at the time, to kick off the trend.
- Personalization
Personalization in marketing is as relevant as ever, but the trick is to do it right. Spotify Wrapped is a masterclass in personalized marketing. Shareability is a factor that makes Wrapped such a success. Spotify also gets top marks for keeping it visually stunning.
Optimizing Livestream Shopping
As the online business world evolves, so do new tactics for bridging the gap between offline and online methods of communicating with consumers for businesses. Among those, livestream shopping stands out as a potent and engaging technique.
In the US market alone, it is reported that the value of the livestream shopping market will hit almost $32 billion by the end of 2023. This number is expected to double to about $68 billion by 2026, making up more than 5% of total eCommerce sales in this world’s largest economy.
With the eCommerce retail market more competitive than ever, organizations that adopt live commerce methods are witnessing conversion rates of up to 30%. This is 10 times higher than the typical eCommerce conversion rate. Meanwhile, 60% of consumers who tried livestream shopping said it improved their shopping experience. This can be explained by the ability to provide real-time interaction between businesses and consumers, allowing for immediate advice and solutions for any customer problems or requests, thus resulting in a more engaging and informative buying experience.

Livestreaming’s effectiveness as a sales channel is further underscored by consumer preferences. A significant 15% of livestream viewers prefer the one-to-many livestreaming format, emphasizing the appeal of interactive and engaging content. Retail companies are taking note of this preference, as they believe that one-to-many live video shopping events align best with their customers’ expectations.
Among the top platforms utilized for live streaming are familiar names like Facebook Live, YouTube Live, and Instagram Live, with adoption rates of 55%, 52%, and 46%, respectively. Amazon Live and companies’ own apps or websites also play significant roles, further solidifying livestream shopping’s presence. It’s evident that retailers are actively leveraging these platforms to connect with customers in real-time, showcase products, and drive sales.
What sets livestream shopping apart is its ability to engage consumers across various platforms. Social media giants like Instagram and Facebook dominate this landscape, capturing 64% of consumer engagement. Additionally, video-sharing platforms like YouTube and TikTok account for 53% of interactions, making livestream shopping accessible to a diverse and global audience. Traditional marketplaces such as Amazon and even TV networks like QVC and HSN are also witnessing substantial consumer participation, reaffirming the versatility and widespread appeal of this sales channel.
Furthermore, the adaptability of livestream shopping is apparent in its varying viewer habits across age groups. Younger audiences, aged 18 to 25, prefer tuning in during the early hours of the day, while those aged 42 to 57 are more inclined to participate in livestream shopping during the evening and late-night hours. This adaptability ensures that livestream shopping can cater to a broad spectrum of consumers
Therefore, integrating livestream shopping into your overall marketing strategy brings great benefits to your eCommerce businesses. To optimize livestream shopping effectively, investing in high-quality livestream content should be the top priority. Education is a key component of a good livestream shopping experience, as 47% of customers expect to hear from industry experts and reviews from other customers.
If businesses already develop their own content, here are other key strategies for livestream shopping optimization.
- Offer personalized experiences: While the one-to-many live streaming format is effective, consider providing one-to-one or one-to-a-few livestream events to connect with customers on their specific needs and provide personalized service. This can improve conversion rates and foster brand loyalty.
- Regularly schedule live streams: Establish a consistent live streaming schedule, whether it’s daily, weekly, or monthly. Regularly scheduled livestreams help build a base of repeat viewers and encourage customer loyalty.
- Embrace viewer preferences: Experiment with different live-streaming formats to match consumer demand. Pay attention to consumer preferences, such as the one-to-many format being popular among both surveyed retail companies and livestream viewers.
By implementing these strategies, brands and retailers can optimize their livestream shopping efforts and enhance the overall customer experience.
How AI Can Help eCommerce Marketers?
The adoption of artificial intelligence (AI) in the eCommerce sector is a developing trend in this digital age, supported by compelling statistics. 78% of eCommerce firms have already deployed or plan to implement AI in their stores. According to Precedence Research, the global AI in eCommerce market size will reach $6.63 billion in 2023 and it is projected to hit around $22.60 billion by 2032, registering a CAGR of 14.60% during the forecast period 2023 to 2032.
A notable statistic showcases that marketers are dedicating an average of five hours a day to manual, administrative, and operational tasks. These tasks, which include keyword research, data cleanup, and content formatting, are essential but time-consuming. However, by implementing AI tools, the average employee can save nearly 2.5 hours a day, equivalent to 25-26 additional working days in a year, on these repetitive and labor-intensive activities. This efficiency gain allows marketers to achieve their tasks in half the time, freeing them to focus on more strategic aspects of their roles.
The game-changer impact of AI on eCommerce marketing is the ability to analyze large datasets and segment customers, enabling more targeted and personalized marketing. In fact, customer-service analytics is the most prevalent use of AI in marketing and sales, with 57% of respondents in emerging economies reporting to have implemented AI. It is also reported that 70% of eCommerce business owners believe AI will help them to make better decisions about personalization. Massive eCommerce firms have applied AI and machine learning to improve product selection and customer customer experience. This facilitates deep customization approaches to personalize material by the user, thus delivering the message that best resonates with customers’ specific needs and wants.
According to a State of Generative AI Report by HubSpot, 35% of marketers are already harnessing the power of AI and automation in their roles, a figure that rises significantly to 54% for bloggers and SEO specialists. While the definition of what constitutes AI or automation can vary, it is likely that even more marketers are benefiting from AI tools without explicitly recognizing them as such.
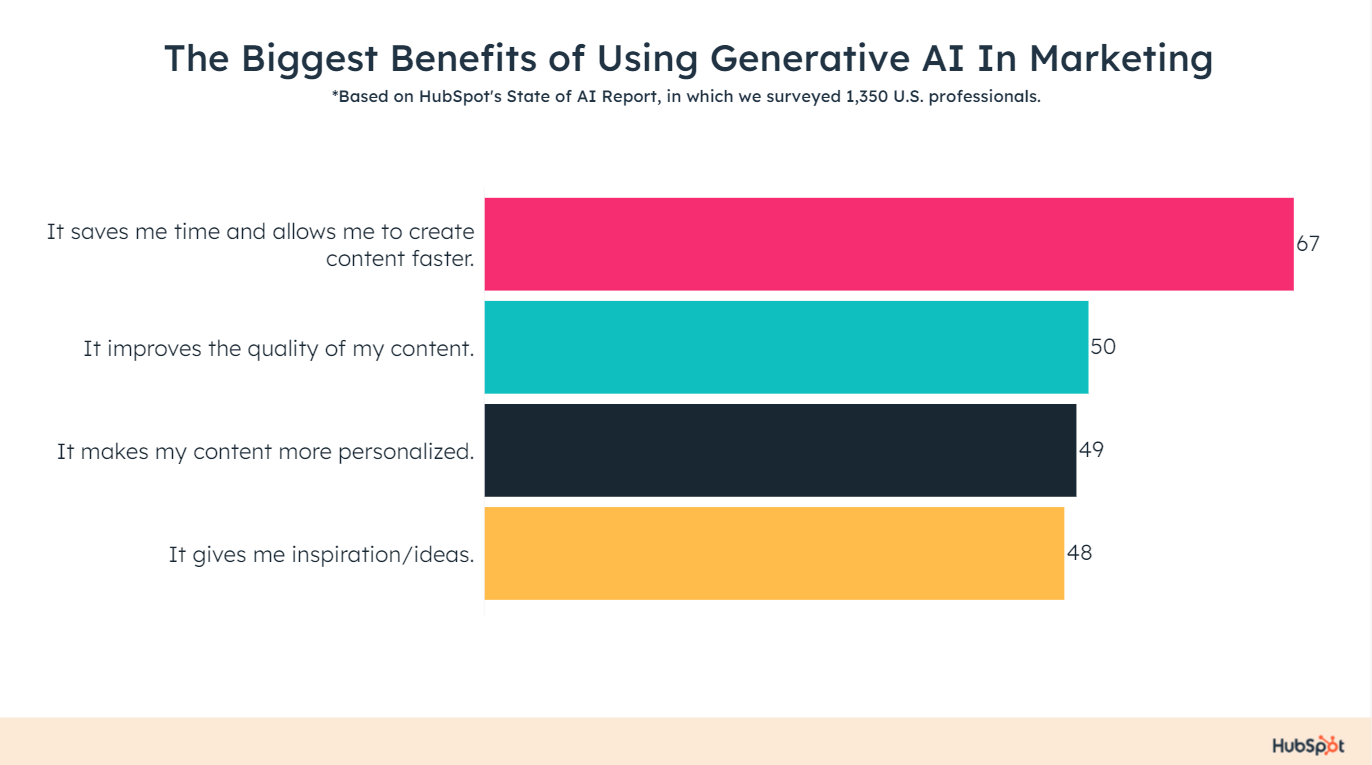
AI tools in marketing encompass a diverse range of applications, with chatbots, text generation tools, visual tools, and audio tools being among the most prominent. With 53% of marketers are leveraging chatbots, and 44% are using text generation tools, emphasizing the breadth of AI’s applications. These tools empower marketers in multiple ways, from automating customer interactions to generating content and enhancing creative processes.
Chatbots are widely considered among the most common forms of AI applications in eCommerce businesses. These tools can assist with order processing, consumer inquiry management, and product recommendation. Statistics shows that the global market size of chatbot is expected to reach a value of $3.99 billion by 2030, equivalent to a growth at a CAGR of 25.7% between 2022 and 2030. Meanwhile, one in every five customers is willing to buy products or services from a chatbot, and 40% of online buyers are seeking excellent discounts and shopping deals from chatbots. Therefore, leveraging this AI technology not only enhances the shopping experience but also reduces the workload on customer support teams, allowing them to focus on more complex issues.
One area where AI is making a substantial difference is in content creation and scaling. Marketers can use AI to generate content, write copy, create images, and even generate outlines. Notably, generative AI is being employed by 45% of marketers to create content. Moreover, when using generative AI to write copy, 35% of marketers leverage it for idea generation, and another third use it to outline content. The majority find that AI-generated content performs better and improves the overall quality of their materials. This is proved by the fact that AI-generated content is perceived as performing better by 63% of marketers, while 89% believe it enhances content quality.
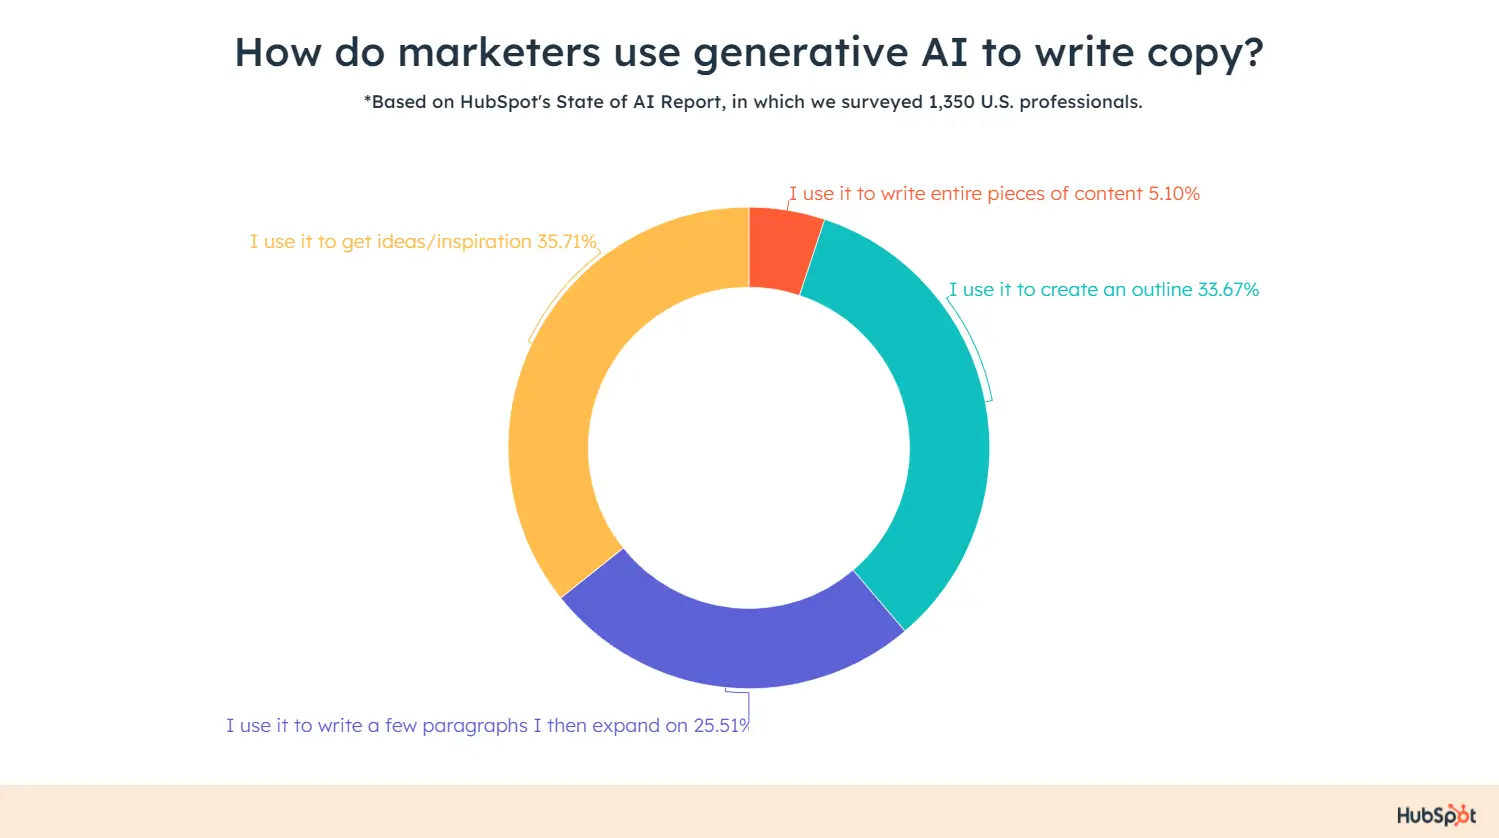
In SEO planning and keyword research, AI is proving to be a game-changer, with 82% of marketers stating that generative AI has impacted the way they plan content creation. Additionally, 69% believe it is crucial to their overall content strategy. Furthermore, AI is assisting marketers in automating time-consuming SEO tasks such as long-tail keyword mapping, internal link building, and SERP comparisons, as well as creating SEO-driven content strategies. This powerful combination of AI and SEO is helping bloggers and SEO specialists optimize their websites, leading to better search engine rankings and improved user experiences.
Social media marketing also benefits from AI, as it enables marketers to generate captions, create platform-specific ads, develop post ideas, and generate content ideas tailored to specific goals. These capabilities empower marketers to engage their audience effectively across various social media platforms.
AI is proving instrumental in crafting marketing email copy, with 28% of marketers using generative AI to create and respond to emails. The advent of AI-powered marketing automation tools allows teams to build targeted lists based on behavioral criteria rapidly. This newfound efficiency enables marketers to focus on strategy, messaging, and brand alignment while harnessing AI to streamline the creation of email content.
Product descriptions are another area where AI is making its mark. AI-generated product descriptions can save marketers considerable time and effort, ensuring that product listings are informative and appealing to customers. More than that, in the realm of data analysis, AI assists marketers in analyzing and reporting on data, helping them derive valuable insights and make informed decisions with 45% of marketers using AI for this purpose.
These are just a few of the benefits that AI can bring to eCommerce marketing. With the current fast-growing pace of this technology, AI will be an indispensable ally for eCommerce marketers in 2023. Customers’ behaviors have been swiftly evolving. By constantly learning from these changing behaviors, along with the support of AI tools, businesses are enabled to make judgments in a variety of areas, thus staying ahead of the curve in the highly competing eCommerce landscape.
eCommerce Social Media Statistics
The popularity and reach of social media are growing in parallel with the worldwide digital population. Nowadays, people of all ages utilize these platforms for a variety of activities, including daily communication, socializing, and purchasing. Social commerce is the combination of eCommerce with social media. It is one of the most popular eCommerce methods for firms due to its unrivaled reach. Here are some noteworthy figures about eCommerce social media in 2023.
Social Commerce Sales Are Projected to Surpass $6 Trillion by 2030
In the dynamic landscape of eCommerce, social media platforms are increasingly becoming pivotal for retail success. According to the online shared data provided by Statista, the global revenue of social commerce has reached $724 billion in 2022. Social commerce continues to grow strongly in usage and popularity. It is forecasted that this revenue will surpass $6 trillion by 2030.
Delving into geographical trends, Thailand leads the pack with 88% of its online population engaged in social commerce, closely followed by India and the UAE at 86%, and China at 84%. These figures underscore the global reliance on social media as a marketplace.
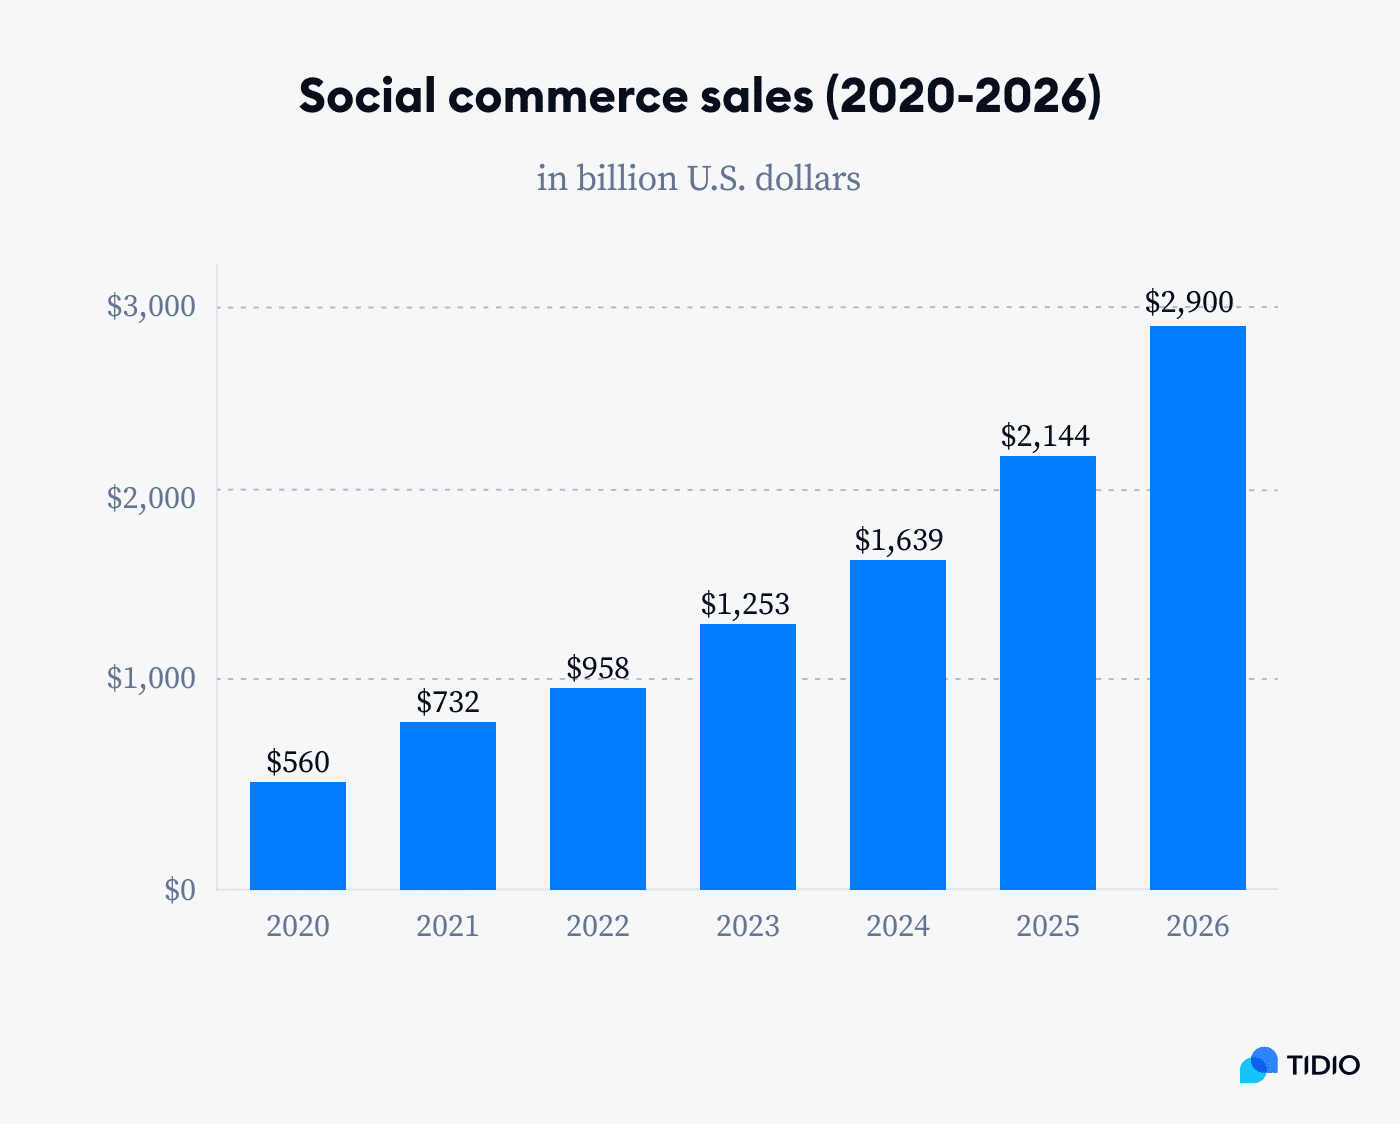
Moreover, platforms like Facebook are not far behind in this retail revolution, with around 1 million users making purchases monthly, showcasing the platform’s potential as a digital storefront. The innovation in social commerce is further driven by trends such as seamless customer experiences, the influence of micro-influencers, and the integration of Artificial Intelligence, shaping the future of online shopping. Notably, millennials are spearheading this movement, anticipated to account for 33% of all social commerce purchases by 2025, thus cementing their role as key contributors to the social commerce economy.
In tandem with user engagement, over 250 million shops have flourished on Facebook, while Instagram is not trailing far behind, with 34% of its users expected to make purchases through the app in 2023. TikTok, the burgeoning social platform, has also recorded substantial consumer spend, exceeding $2.5 billion, indicative of its rapidly growing eCommerce influence. Despite these promising figures, the industry does face challenges, chiefly concerning consumer trust, with 37% of buyers expressing concerns over payment security. Additionally, logistical issues such as inventory management, returns, refunds, and overall user experience remain critical hurdles that social commerce needs to navigate to maintain its growth trajectory.
Internet Users Aged 16 to 64 Spend Nearly 40% of Their Online Time on Social Media
Individuals’ use of social media has increased significantly over the last decade. In 2023, the average amount of time each day that internet users aged 16 to 24 spend on social media is 2 hours and 31 minutes. This is a 2% increase from the previous year’s report. To put this in context, internet users in this age range spend roughly 40% of their online time on social media.
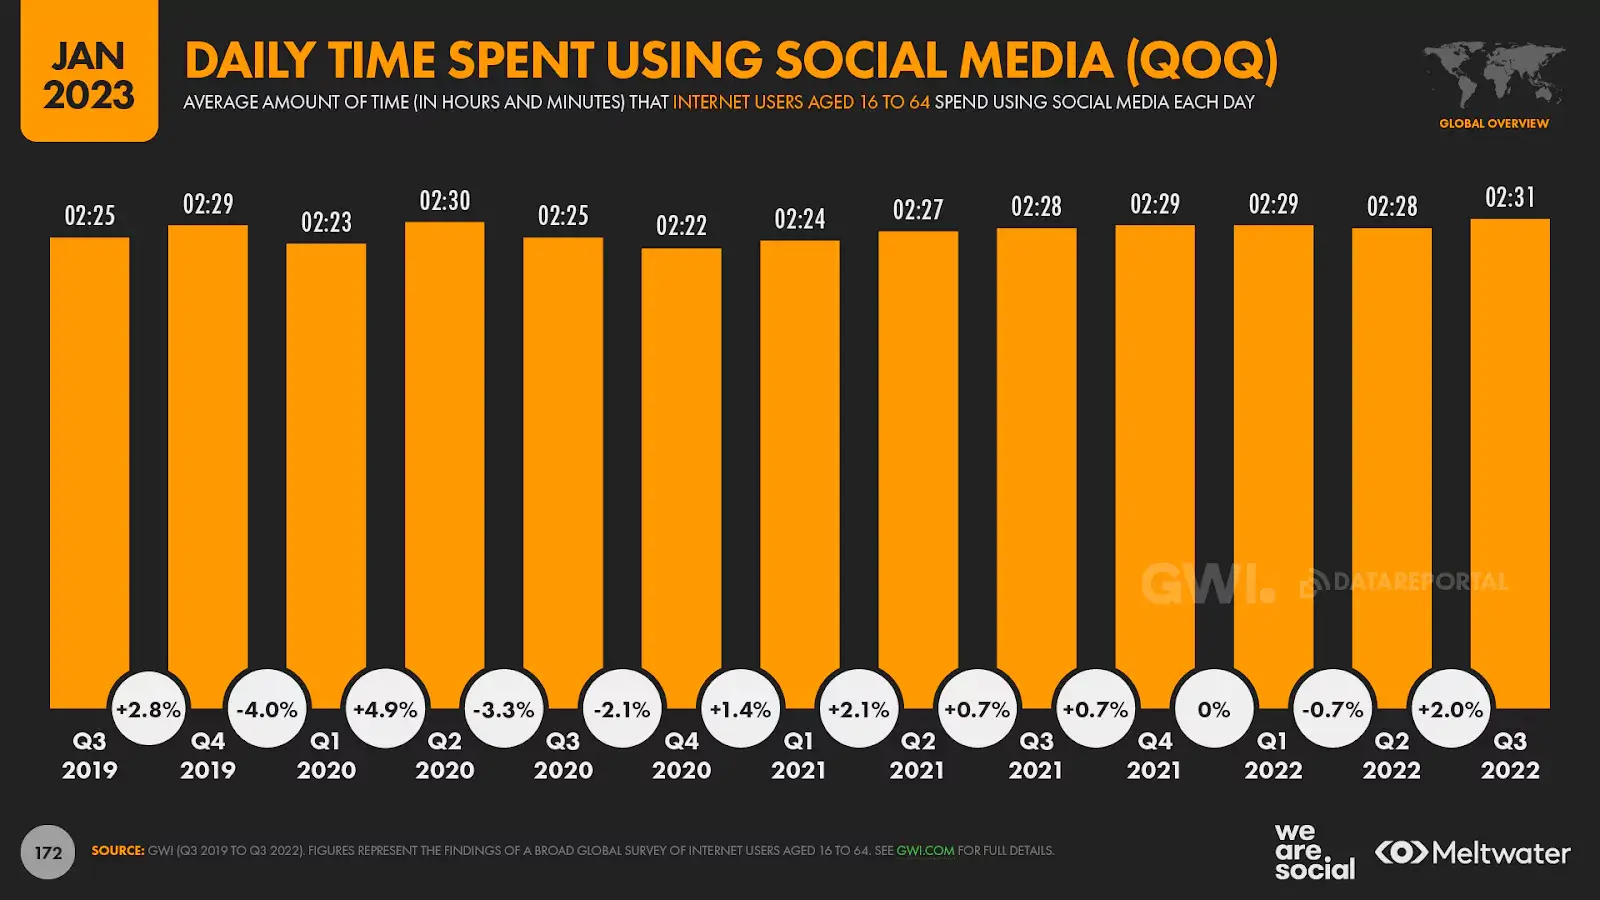
This change in daily social media usage of internet users aged 16 to 64 varies across different regions. Latin America leads the ranking, where users now spend an average of 3 hours and 20 minutes daily on social media, representing a significant increase from the previous year. Following closely is Africa, with users dedicating around 3 hours and 15 minutes, marking a noticeable uptick in usage. Asia-Pacific regions show a moderate increase, with users spending approximately 2 hours and 40 minutes, slightly higher than the previous year. In Europe, the rise is more modest, with an average usage time of 1 hour and 50 minutes. North America, while still experiencing an increase, shows the smallest change, with users now spending around 2 hours and 10 minutes per day on social platforms.
When asked what their main reasons for using social media were, nearly 28% of internet users aged 16 to 64 said it was to find inspiration for things to do or buy. Just over 26% said it was to find products they could buy. Even if they aren’t shopping on it, it’s proving to be an effective channel for brands, with 23% saying they primarily use it to see content posted by their favorite brands. In another report provided by Hubspot, consumers aged 18-54 prefer using social media to discover new products.
These statistics clearly demonstrate the opportunities for businesses to reach a broader range of customers and raise brand awareness through the use of social media for eCommerce. Businesses should quickly adapt to this changing customer preference for shopping via social media and adjust accordingly. Some eCommerce platforms, such as WordPress, include social media plugins that can be used to encourage customers to share your products and content.
China Is the Social Shopping Leader
Looking from a geographical perspective, Asian nations are especially fond of social shopping. Social buyers comprise more than 80% of the online population in Thailand, India, and China. To provide some context, the retail value of social commerce in China is approximately 10 times that of the United States, making this the leading market for social shopping.
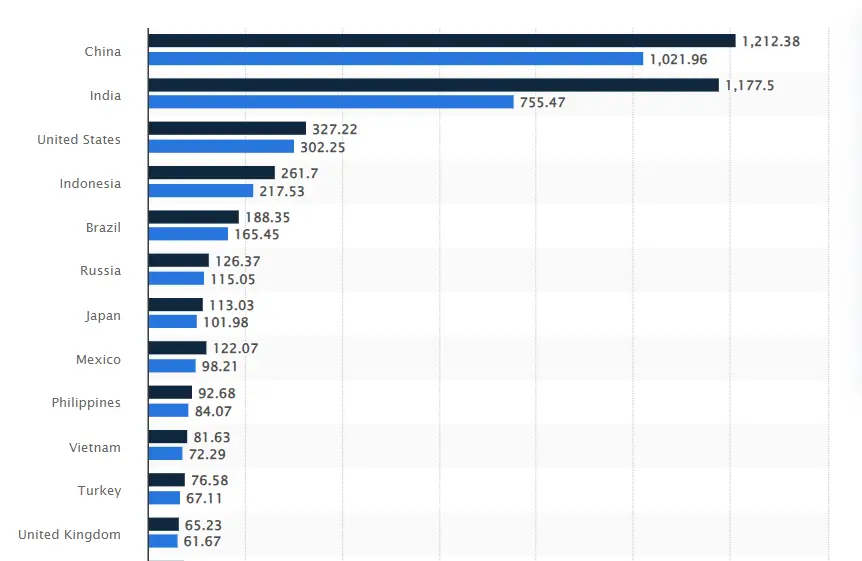
China has the largest social media population worldwide, with 1.021 million users as reported in 2022. This number is expected to reach 1.212 million by 2027. On average, Chinese internet users spend nearly two hours per day on social media. It is reported that 84% of Chinese consumers have done shopping on social media channels, among the highest rates in the world. According to McKinsey, Chinese consumers spent $352 billion on all social commerce.
In terms of market size, China’s eCommerce sector comprises 45.3% of the nation’s total retail sales, tripling the size of the US eCommerce market, which stands at 16.1%. The industry in China is not just vast but also on a rapid growth trajectory, with projections indicating that it could expand to a $2 trillion market by 2028, growing at an impressive annual rate of 33.7%. With the fast acceleration of China’s economy, this data shows no sign of decreasing.
The Number of US Social Buyers Is Still Increasing Fast
Despite being outpaced by China, the social commerce industry in the United States still experiences significant growth. It is estimated by eMarketer that there will be 107 million social buyers in the US by the end of 2023.
The US social media users are reported to reach 302.35 million in 2023, equivalent to 90% of its total population. According to the Insider Intelligence’s report, nearly 36% of those are social buyers. It is projected that with the increasing influence of social media, the annual social spending in the US will increase by $419 per buyer over the next three years. As a result, reports also estimate that the total social commerce sales in this world-leading economy will see a significant growth from $67.06 billion in 2023 to $144.52 billion in 2027.

Social media advertising has a significant impact on the purchasing habits of Americans. The U.S. also has the highest social media advertising expenditure, reaching $72.33 billion in 2023. The shift in consumer buying habits is most visible among younger generations, specifically Gen Z and millennials. According to the survey, nearly two-thirds (63%) of Gen Z shoppers and half (51%) of millennial shoppers in the United States purchased something they saw on social media. Facebook ranks as the top social commerce platform in the U.S., with 63.5 million buyers recorded.
Utilizing social media algorithms to identify user preferences and deliver tailored recommendations has proven to be a critical factor in attracting customers within this particular age group. According to Statista, social platforms have become a primary resource for product discovery and search for many millennials and Generation Z. To the extent that at least one in every two U.S. consumers in that age group appears to prefer these networks over online searches for discovering new products.
Social Commerce Is Much More Popular among Young People
It is not unique to the United States that social commerce is primarily driven by the younger generation. According to a survey retrieved from global social media marketers in 2023, over 1 in 5 Gen Z, Millennial, and Gen X social media users bought a product directly in a social media app in the past 3 months. Another report also found that 41% of Gen Z and Millennials make an impulse purchase online every 2-3 weeks.
Wearesocial report provides a clear indication that social commerce is markedly more prevalent among the younger demographics. This trend is evidenced by the percentages of active social media users within various age brackets.
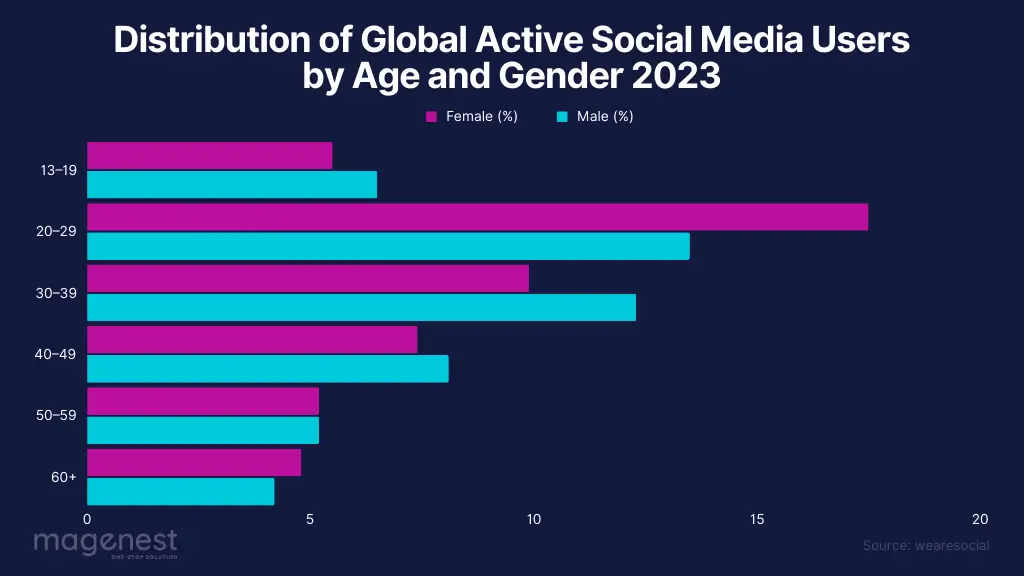
Starting with the youngest group, individuals aged 13–19, we observe that 5.5% of females and 6.5% of males are active on social media. This engagement significantly jumps in the subsequent age group, 20–29 years, where we see the highest engagement rates: 17.5% for females and 13.5% for males. This suggests not only a high level of social media use but also potential participation in social commerce activities given the age group’s familiarity and comfort with digital platforms.
Moving into the 30–39 age group, the percentages remain substantial at 9.9% for females and 12.3% for males, signaling a sustained but slightly reduced engagement compared to the 20–29 bracket. As we progress to older demographics, the numbers continue to trend downward. For those aged 40–49, the active user percentages are 7.4% for females and 8.1% for males. This gradual decline is more pronounced as we look at the 50–59 age group, where both females and males have an active user percentage of 5.2%.
The trend reaches its lowest point in the 60+ age group, where the figures drop to 4.8% for females and 4.2% for males. These statistics underscore a clear pattern: younger individuals, particularly those in their twenties, are the most active on social media and, by correlation, the most engaged in social commerce. This could be attributed to various factors, including the higher digital literacy among younger generations, the integration of social media into their daily lives, and the appeal of social commerce features such as influencer marketing and integrated shopping experiences that resonate more with a younger audience.
The stark contrast between the engagement levels of the youngest and oldest age groups on social media platforms suggests that social commerce strategies might be more effective if they are tailored toward younger users who are more inclined to shop in these digital environments. However, it’s also a call to action for marketers and platforms to innovate and adapt their approaches to engage older demographics, who represent a significant portion of the consumer market.
Although social commerce has gained traction across all age groups, it is indisputable that it is especially popular among users aged 26 to 41, accounting for approximately 58% of online shoppers, according to Statista. As a result, millennials are the generation with the highest adoption of social shopping. It is followed by users aged 18 to 25, with more than half reporting having shopped on these platforms.
Aside from having the financial means to indulge, Millennials witnessed the world’s digital transformation firsthand, making them more susceptible to social media shopping. Millennials also have the best-targeted ads and the most fun social shopping. However, there are some disadvantages to this growing phenomenon. Unprotected purchases, ineligible reimbursements, and insufficient product information are all concerns for global consumers.
Most Marketers Agree That Social Data is Precise, yet Easy to Get
Social media has emerged as a treasure trove of data that holds immense value for marketers seeking to understand their audience, make data-driven decisions, and fine-tune their strategies. According to the report distributed by Sprout Social, 65% of respondents utilize social data to inform their sales strategy, 44% to improve the customer experience, and 40% to gain insight into the competition.
The value of leveraging data from social media has been widely accepted by marketers. According to the 2023 Global Social Media Trends report, over 90% of marketers are confident that their social media marketing activities in 2023 will bring a positive ROI. Meanwhile, 87% of marketers believe that customers will find their brand on social media more often than through search engines.

With the increasing usage of social media for both businesses and Internet users, social data are becoming more accessible, both in terms of competitors’ and customers’ data for businesses. It also comes with great precision due to its ability to provide insights into the behaviors, preferences, and sentiments of a target audience. Platforms like Facebook, Twitter, and Instagram collect a wealth of user-generated content, including posts, comments, likes, shares, and interactions. This allows marketers to easily collect, analyze, and gain deep insights into consumer sentiment, product preferences, and emerging trends.
Competitors’ data
As we mentioned above, 40% of businesses utilize social data to gain insight into competition. According to PwC, 56% of executives observe potential competitors’ activities and aim to enter new markets in the next three years.
Competitors’ data are yet easy to get from social media. Social media platforms provide a wealth of information about the content, products, and promotions that resonate with the audience. These data are publicly available, making them easy and cost-free to obtain. Marketers can monitor the performance of their competitors’ social media posts to spot emerging trends and adjust their own strategies accordingly.
Another common application of analyzing competitors’ data is that it allows businesses to benchmark their performance against competitors. With its easy-to-assess nature, the marketing team can examine and evaluate competitors’ reach, engagement, and brand sentiment in comparison to industry rivals. This information aids in setting realistic goals, optimizing strategies, and identifying opportunities for improvement.
Customers’ data
Social platforms provide a goldmine of customer data, including demographic information, interests, and behavior patterns. 60% of marketers reported that they leveraged customer data the majority of the time when making decisions.
An effective application of customers’ data is the capability to implement personalized marketing campaigns. The available data on customers’ past purchases and interactions allows eCommerce marketers to gain a deeper understanding of customers’ insights, thus creating precise targeting and tailored content. This can include personalized product recommendations, targeted offers, and creating content that resonates with individual customers. This level of personalization has been shown to increase revenue and customer loyalty.
Social media is an open platform where customers can freely share their opinions and experiences, including product reviews, comments, and feedback. These are valuable data for eCommerce marketers to receive more insights on their product’s strengths and weaknesses, thus making appropriate improvements to enhance their products or services quality. The feedback provided is of immense value in enhancing product development and consumer support.
Making the Most out of UGC on Social Channels
User-Generated Content (UGC) refers to any content created by individuals, such as customers, rather than the brand itself. This content can take various forms, including reviews, photos, videos, and social media posts. With its flexibility in content types and creativity, UGC has emerged as a powerful and authentic marketing tool for eCommerce businesses to build trust, enhance brand image, and eventually drive sales.
Looking from a customer perspective, a staggering 93% of customers say user-generated content is extremely helpful when making a purchasing choice. Another report shows that 48% of respondents consider UGC a great method to discover new products. On the other hand, 74% of consumers rely heavily on social media to help them make purchase decisions. These numbers highlight the importance of leveraging UGC on social media platforms.
From a business perspective, the benefits of UGC lie in the fact that brands can save an amount of expense for a dedicated content producer at $72,000. Due to its authenticity, UGC is recorded to be 35% more memorable than content from professional marketers. When it comes to results, social media campaigns that incorporate UGC get 50% more engagement and 29% higher conversion rates than campaigns that don’t use.

UGC is undeniably a powerful tool for eCommerce businesses. In fact, it is reported that approximately 70% of brands believe that UGC helps them connect better with customers on social media. Meanwhile, one-quarter of search results (25%) for the world’s biggest brands are links to user-generated content.
Acknowledging that UGC is gaining great popularity in 2023, integrating this method into social marketing strategies can be a potential game changer for eCommerce businesses. To make the most of this strategic imperative, a recommended practice is to encourage customers to share their experiences and create content related to the products. You can also consider offering incentives such as discounts, exclusive access, or contests to motivate users to generate content. After users have created UGC, businesses should actively engage with them. Responding to comments, expressing appreciation, and sharing user content on the brand’s social channels fosters a sense of community and encourages more users to participate.
Brand’s Reputation & Authenticity Can Be Generated and Maintained on Social Channels
With the increasing use of social media among businesses, this powerful platform has emerged as a dynamic stage where brands showcase their values, engage with their audience, and build a transparent narrative that fosters trust. The unlimited creativity and connection allow businesses to humanize their images, user-generated content, and stories that resonate with their audiences while strengthening their reputation and authenticity.
In the digital age, consumers increasingly turn to social media platforms to not only discover new products but also to evaluate the authenticity and reputation of brands. Statistics by Gartner regarding brand reputation show that 64% of buyers who feel a close connection with a brand are more willing to pay a premium price for its products and services. Meanwhile, authenticity is among the most important factors for 90% of customers when deciding which brands to support.

However, it is important to note that social media is a double-edged sword that can make or break your brand. With the increasing usage of social media all over the world, a single negative review or post can quickly spiral out of control and permanently harm your reputation. In fact, 94% of consumers will prefer avoiding businesses that received negative reviews.
Therefore, it is more important than ever to build a strong and positive online reputation for your businesses. You can start with consistently delivering authentic and meaningful content, and responding promptly to customer inquiries and feedback. Authenticity, however, involves more than just polished marketing content; it encompasses genuine interactions, transparent communication, and a commitment to delivering on brand promises. According to Harvard Business Review, 64% of consumers say that shared values are the main reason that they have a trusted relationship with a brand.
By maintaining a consistent and genuine presence on social media, your brand can not only improve its reputation but also cultivate a loyal community of followers who feel a deeper connection to the brand’s authenticity. Having high customer retention and a good brand reputation are critical factors for your business success.
Top Macro eCommerce trends to watch
2024 Will Be the AI and Machine Learning Era
The year 2023 marks the domination of Artificial Intelligence (AI) and Machine Learning (ML) in the eCommerce realm. These technologies are revolutionizing the way businesses operate, providing unprecedented insights, personalization, and efficiency in the eCommerce sector.
According to statistics by Next Move Strategy Consulting, the global artificial intelligence market size will be valued at $207.9 billion in 2023 and is expected to grow at a CAGR of 32,9% from 2023 to 2030. It is forecasted that in 2030, this market will reach $1,847.4 billion. The United States is reported to own the largest AI market size, reaching $87.18 billion in 2023.
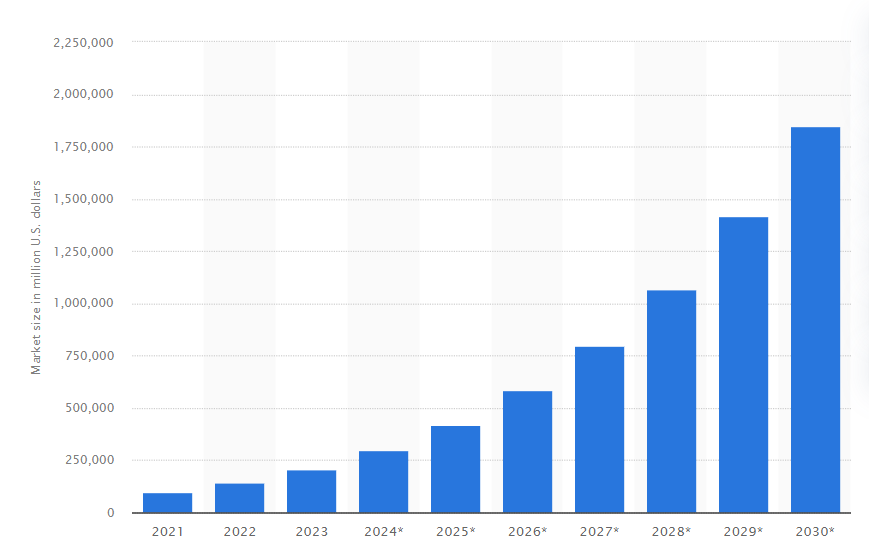
The AI market covers a vast number of industries, from supply chain, and marketing to research and analysis. The Healthcare industry has the largest share of the AI/ML market, at 15,7%. This is followed by Finance and Manufacturing with 13,65% market share, and Business & Legal Services, at 13,6%.
The year 2023 also marks the rise of generative AI tools, highlighting the mainstream prominence of this trend. According to Statista, the generative AI market size is expected to reach $44.89 billion in 2023, experiencing a 93% change from 2022. With its continued trajectory, this market is projected to reach $207 billion by 2023. ChatGPT is the most used text generation AI tool in 2023, chosen by 19.73% of users, while Midjourney is the most popular image generation AI tool, accounting for 26.87% of global usage.
With the domination of AI and ML, early adopters of AI have reported to reap their benefits easily. The most desirable result is increased revenue as it underpins the whole business model. The application of AI brings great benefits to every aspect of business, especially supply chain management and human resources.
It is indisputable that the AI/ML era will continue to grow stronger in the upcoming years. To leverage the power of AI and ML in eCommerce effectively, businesses should invest in robust data analytics systems, collaborate with AI solution providers, and ensure that their teams are equipped with the necessary skills. Additionally, integrating AI-driven features into websites and mobile applications, such as virtual try-on experiences or personalized shopping assistants, can provide a competitive edge.
90% of Businesses Prioritize a Customer-Centric Approach
To stand out in the competitive eCommerce marketplace, businesses must come up with ways to engage and deliver the best customer experience (CX). This highlights the significance of the customer-centric approach, which has gained considerable popularity in these years.
At its core, a customer-centric approach revolves around prioritizing the needs, preferences, and experiences of customers throughout their journey with the brand. It entails placing the customer at the center of all business strategies and decisions, aiming to provide a seamless, personalized, and satisfying experience at every touchpoint. Statistics show that 90% of businesses, regardless of the vertical they are operating in, reveal that they consider CX as their primary focus, underlining the significant impact of a customer-centric approach to businesses.
The importance of a customer-centric approach is also reflected in the increasing customer expectations. Companies that fail to take action to meet these new expectations risk losing opportunities in a world where customers can easily switch to a competitor. According to Zendesk CX Trends Report 2023, 60% of consumers have purchased something from one brand over another based on the service they expect to receive. Another report says that 61% of consumers will pay at least 5% more if they know they’ll get a good customer experience, while 60% will switch brands due to a negative contact center experience.
Gaining a thorough understanding of customer insight is the key to delivering a customer-centric experience. This can be achieved by gathering and analyzing data from various resources such as purchase history, feedback, and interactions, thus creating tailored products, services, and marketing efforts to meet specific customer needs.
Providing exceptional customer service is also pivotal in a customer-centric strategy. Given that 72% of customers want immediate service, businesses should be available, responsive, and helpful at all stages of the customer journey. By truly understanding customers, listening to their feedback, delivering exceptional service, and personalizing experiences, businesses can create a loyal customer base, drive revenue, and foster sustainable growth in an increasingly competitive market.
Mobile First Approach Should Still Be Prioritized
The Mobile First trend is still a concerning issue in 2023. A total of 5.44 billion people used mobile phones in early 2023, equating to 68% of the total global population. In the past year, the number of unique mobile users has increased by slightly more than 3 percent, reaching 168 million in the last 12 months. This highlights the critical importance of catering to the preferences and behaviors of mobile users in today’s eCommerce landscape.
Following this increasing use of mobile devices, mobile commerce, or mCommerce, also experiences a significant rise in 2023. Global mCommerce market worth $2.2 trillion in 2023 and is expected to reach $3.4 trillion by 2027, as a result of continuous growth.
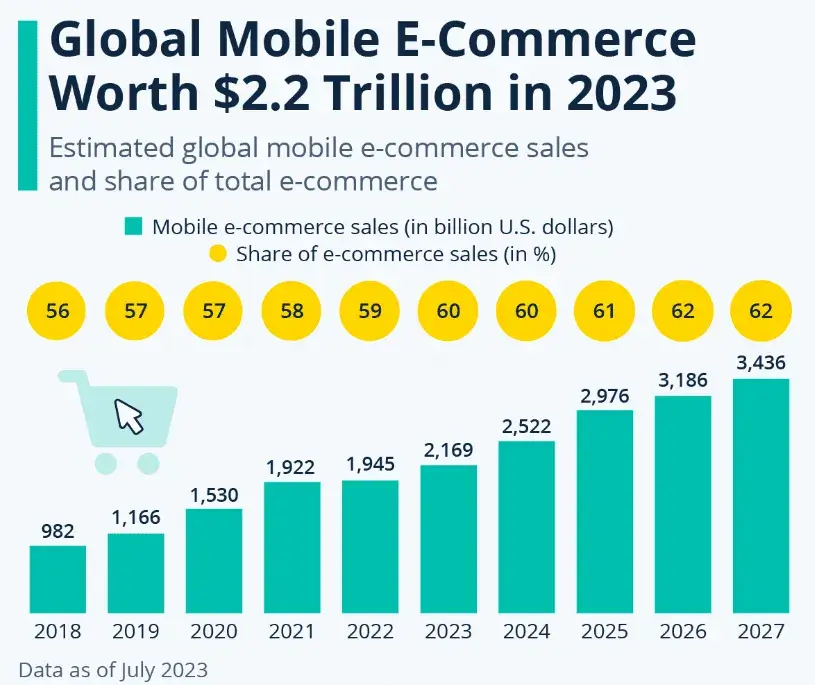
A highlighted statistic of 2023 is the average time a mobile user spends using their phone, which is more than 5 hours per day. This equates to a year-on-year increase of 2.4% compared to the data in 2022. Social and communications apps claim the largest share of mobile time, at 40%, followed by photo and video apps.
With the global use and average time spent on mobile devices increasing, the online retail market is facilitated to expand. Statistics reveal that 58.33% of global web traffic comes from mobile devices in Q1 of 2023. In the meantime, 74% of retail site traffic worldwide is reported to come from smartphones, generating 63% of online shopping orders. Statistics also show that mCommerce comprised 65.7% of the total global eCommerce retail sales, which is nearly two-thirds.
Global statistics on mCommerce indicate that the majority of companies prioritize developing mobile-friendly experiences in order to foster business growth. The mobile-first strategy is an absolute necessity in the current eCommerce environment.
Implementing a mobile-first approach involves prioritizing mobile user experience in design. It’s built on principles like responsive web design (RWD), which creates flexible websites adaptable to various screen sizes, and progressive enhancement, starting with a basic product version and adding complexity over time. This approach contrasts with graceful degradation, where complex designs are simplified for compatibility with different platforms.
Aside from the design, other aspects included in the mobile-first strategy are optimizing content, identifying a visual hierarchy, building wireframes, leveraging mobile intuition, avoiding large media files, and testing prototypes on real devices. To put it simply, it’s all about creating simple yet effective user experiences. By adopting this approach, businesses can capitalize on the growing number of mobile users, boost engagement, drive conversions, and stay competitive in the evolving world of online commerce.
Diversity of Marketing Approaches & Methods
In this ever-evolving digital and technology-driven world, marketing also comes with innovative ways for businesses to diversify their strategy to reach customers.
A notable marketing approach in 2023 is social commerce, which has previously been highlighted. Some common types of social commerce include Facebook, Instagram shopping, and TikTok shop. Statistics reveal that the number of users making purchases through TikTok increased from 9.6% in 2022 to 33.3% in 2023. With global social media users accounting for 60% of the world population, the future of social commerce is still witnessing a significant rise.
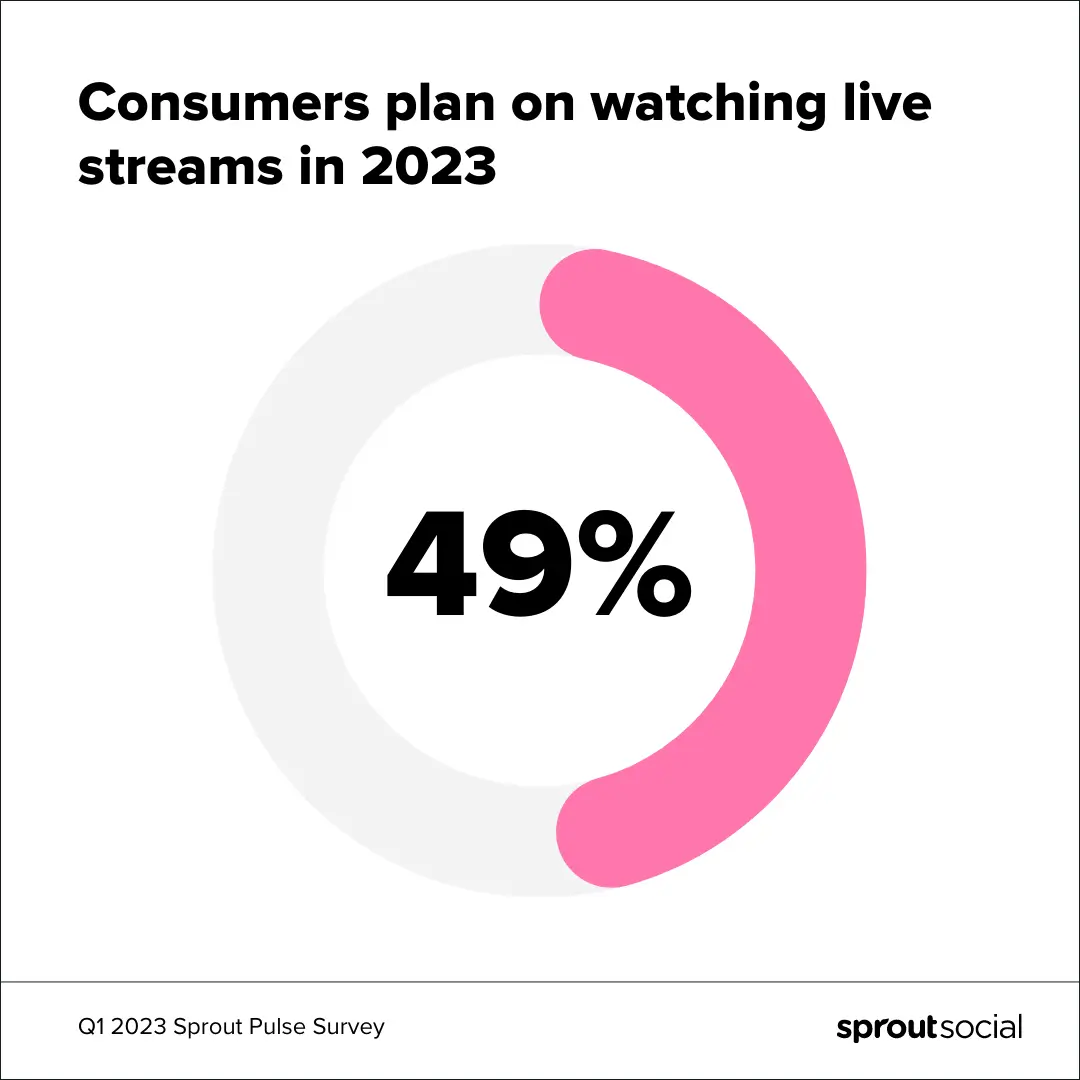
Following the growth of social commerce, livestream shopping holds an important position among the effective eCommerce marketing approaches. According to the Sprout Pulse survey, 49% of consumers plan on watching live streams in 2023. Meanwhile, this market is expected to hit almost $32 billion by the end of 2023 in the US market. Livestream shopping is being embraced even by conventional television shopping networks such as QVC. It is also accessible through the QVC streaming app, Facebook, and YouTube.
With 79% of customers preferring live chat support in their shopping experience, conversational marketing is another potent marketing tool for businesses to increase customer engagement. As the Sprout Pulse survey reveals, 26% of marketers plan to use conversational marketing in 2023, a 6% increase from 2022. Common approaches to conversational marketing include text-based tools like chatbot, and live agent; or voice-based tools such as voice shopping.
Finally, acknowledging that mCommerce is surging in popularity, omnichannel marketing stands as the best marketing method for any eCommerce business. Reports indicate that a 494% higher order rate (0.83% vs 0.14%) is seen in marketing campaigns that use at least three channels, as compared to those launched on just one channel. With the rise of social media shopping, more than 60% of consumers reported to participate in omnichannel shopping. These statistics have highlighted the importance of omnichannel marketing strategies for eCommerce businesses.
A Challenging Global Supply Chain: Always Readily Have a Mature Planning Capability, Agility, and an End-to-end Forward-looking Visibility
The global supply chain has been disrupted negatively by the COVID-19 pandemic. In 2023, supply chain operations will continue to be disrupted by geopolitical conflicts, inflationary pressures, the recessionary environment, climate change-related weather events, and other yet-to-be-identified challenges.
The year 2023 witnessed a significant transformation in the world’s geopolitical landscape. According to KPMG’s report, more than 6 out of 10 global organizations expect that this instability will have a detrimental impact on their supply chain. If tensions escalate, essential materials may be inaccessible.
Another challenge for global supply chains is the increased raw material costs, which is highlighted by 71% of global companies as their number one threat. Organizations may experience limited access to critical inputs for manufacturing, followed by fluctuations in key commodity prices and availability of those items.
The increasing demand of customers also poses a challenge for global supply chains. While getting goods into the hands of consumers in 2023 might appear easier than in earlier COVID-19 times, it will likely not be simple nor inexpensive. Although there are currently a greater number of consumption mechanisms and channels available, costs continue to rise. 67% of organizations consider meeting customer expectations for speed of delivery as a critical force impacting the structure and flow of their supply chains. Consequently, they may also face challenges of applying last-mile delivery along with the reliance on suppliers.
These are among the common supply chain trends in 2023. KPMG recommends that in order to mitigate risks and identify areas of susceptibility, organizations possess advanced planning capabilities and agility, which are facilitated by enhanced end-to-end visibility across the entire supply chain. Establishing robust supply chains capable of enduring forthcoming disruptions and swiftly adjusting to emerging changes will additionally enable enterprises to capitalize on advantageous prospects that would otherwise be inaccessible.
China, APAC, and Africa Are Potential eCommerce Markets
As illustrated above, China is the largest eCommerce market, generating almost 50% of the world’s transactions. China is the country with the highest percentage of online retail sales in 2023, at 47%. This data is expected to increase significantly, reaching $3.5 trillion by 2024.
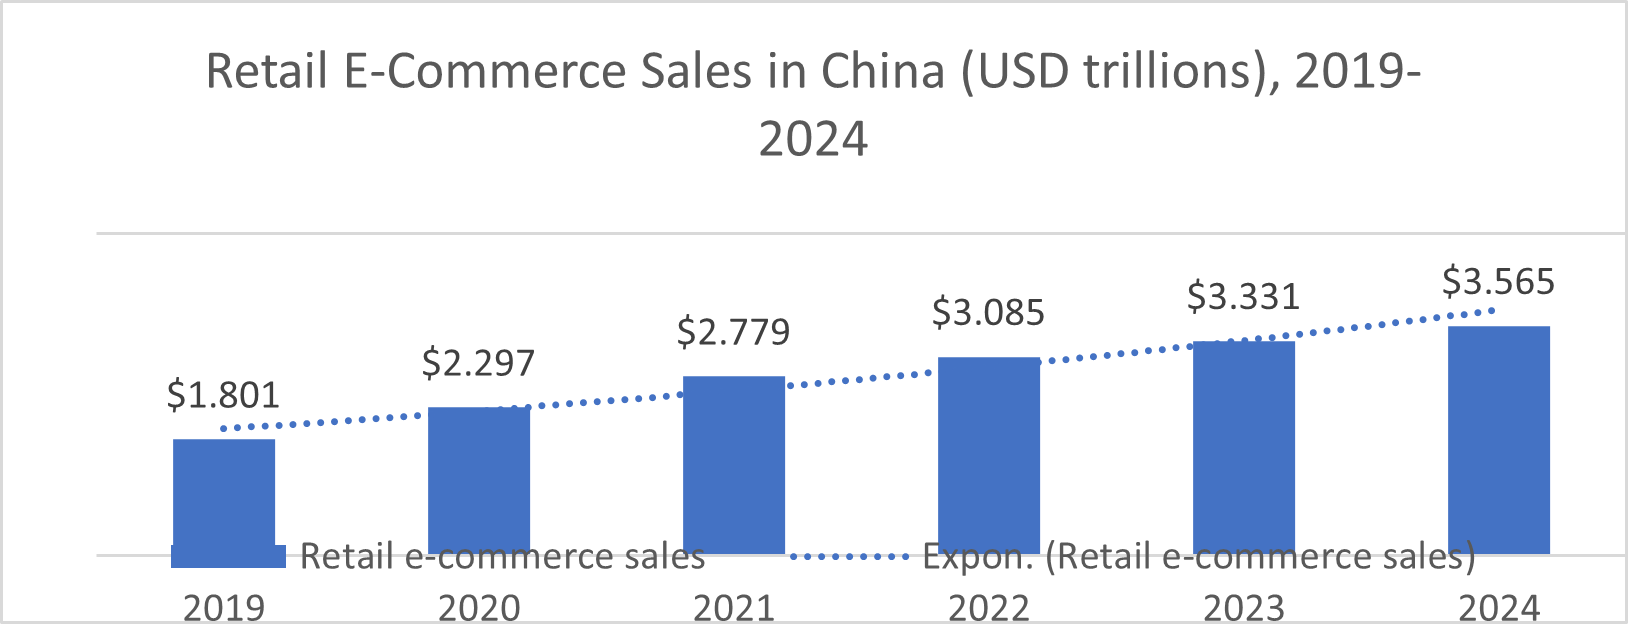
At present, China boasts the most substantial digital consumer base globally, comprising close to 850 million individuals. In recent times, China’s eCommerce sector has witnessed the incorporation of new features, including quick shipping and live streaming, which have served to enhance the overall consumer experience.
The domestic platforms that dominate China’s eCommerce sector include Alibaba’s Taobao and Tmall (50.8% market share), JD.com (15.9%), and Pinduoduo (13.2%). Other platforms with a significant market share include Kaola, Little Red Book (Xiaohongshu), Alibaba, Suning, Dianping, Gome, Vipshop, Yihaodian, Dangdang, Mogujie, and JuMei. Platform selection is currently quite dynamic and varies greatly based on industry, target market, and geographical region.
International firms wishing to establish an online presence in China can choose to use cross-border eCommerce to sell products from abroad. In the first quarter of 2023, China’s cross-border eCommerce trade scale hit $60 billion. Firms can benefit from streamlined Chinese customs procedures through China’s over 100 cross-border eCommerce-integrated pilot zones.
Aside from China, Asia-Pacific is a booming eCommerce region. Since emerging as a global, dominant force, the APAC eCommerce market has risen tremendously, with numerous markets providing the highest eCommerce revenues worldwide. Its market size is expected to grow from $3.82 trillion in 2023 to $6.15 trillion by 2028, at a CAGR of 10% during the forecast period (2023-2028).
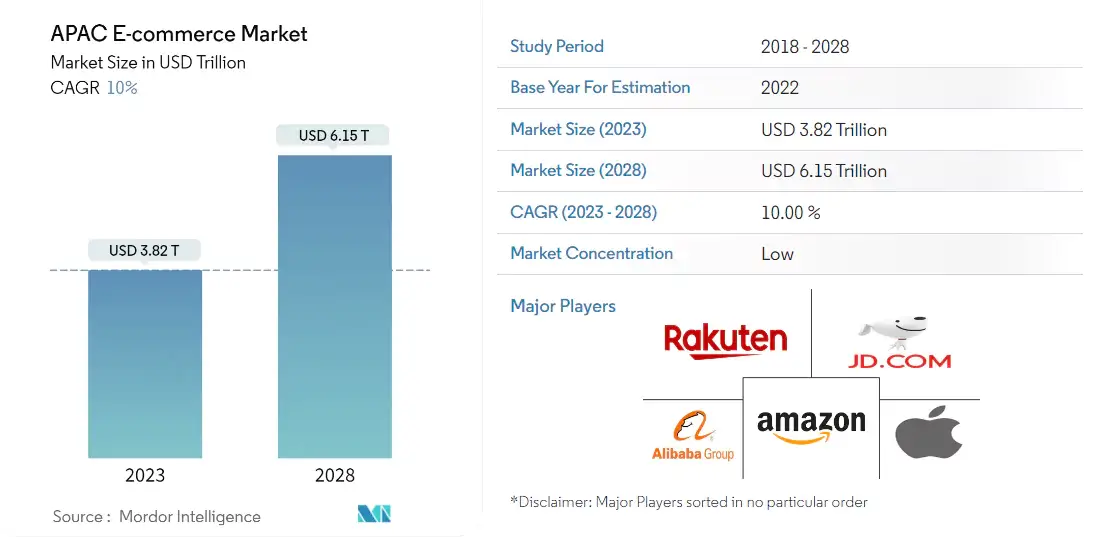
One of the driving forces behind the growth of eCommerce market in this region is the emergence of a growing middle class. Between 2020-2023, the middle-class population in Asia-Pacific is projected to increase from 2 billion to 3.5 billion people – an increase of 73% and equivalent to 89% of the global growth.
At the same time, the transition from brick-and-mortar to eCommerce seems inevitable in the expansion of Internet access among consumers in the region. The year 2022 saw an explosion in the number of online users in the region, reaching over 2.6 billion. Social media is a driving force for this expansion. APAC region has the social media penetration rates recorded to be as high as internet penetration rates. Facebook was by far the most popular social media platform in the region, with nearly 1.3 billion monthly active users. This has led to the rise of social commerce in this region, which is expected to grow by 14.7% on an annual basis and reach $489.3 million in 2023.
Another growing region for eCommerce industry is Africa. The revenue in the eCommerce market in Africa was forecast to continuously increase between 2023 and 2028 by in total of $22.5 billion, equivalent to 77% growth. After the sixth consecutive increasing year, the indicator is estimated to reach $51.73 billion and therefore a new peak in 2028. The number of eCommerce users in Africa is expected to grow steadily at a CAGR of 17%, reaching 519.8 billion by 2025.
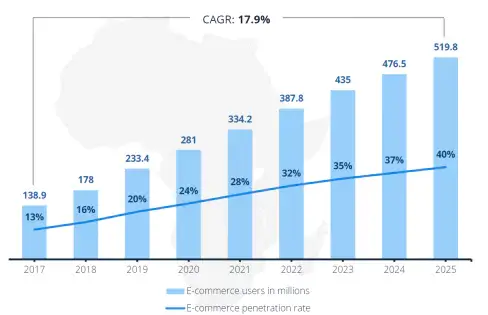
The driving force for the growth of eCommerce market in Africa is the increasing mobile internet and total internet penetration. As reported by the International Trade Administration, this continent leads mobile internet usage with the number of users being 13% above the global average. At the same time, 69% of the total web traffic in this region comes from mobile internet users, therefore, Africa is expected to be an almost exclusively mobile-based market by 2040.
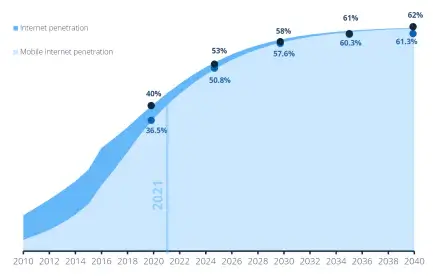
The above figure indicates the potential of leveraging a mobile-first approach in Africa’s eCommerce market. For any business seeking to sell online to various African markets, delivering an excellent and seamless mobile experience is critically important to reaping the full opportunity of this booming region.
However, online payments remain a perennial challenge in eCommerce markets in Africa. African countries still fall behind global consumer banking habits, with nearly half of adults not having a formal bank account and preferring to pay in cash. Debit card payment methods have a 10% population penetration, whereas credit card ownership rates are low, with an average of 2% across the continent. Firms should make clear considerations in choosing appropriate payment methods when establishing eCommerce in Africa.
Adaptation to Local markets
While globalization is a trending phenomenon and a goal of many businesses wishing to expand across the border, localization is critically important in gaining customer engagement in different countries and regions.
There are 4.72 billion Internet users in the world, however, only 25.9% of them are English speakers. Consequently, although 52% of all websites are in English, it only reaches 25% of all Internet users. This highlights the importance of speaking the customers’ language. According to CSA Research, 55% of global consumers only purchase from websites that display product information in their own language, while 87% of customers would not buy from an English-only website.
An app that fails to localize for local audiences can lose up to 13% of customers. For this reason, almost half of marketers agree that geo-targeting yields the highest ROI for their ad spend. Localization can increase search traffic by 47%, boost website visits by 70%, and increase conversion rates by 20%.
The Flow.io survey indicates that users place importance on website navigation and content. Therefore, it is not required for companies to translate the whole site from the beginning. Investment in translation should be in perfecting heavily trafficked areas of the sites: headlines, product names, and so on. The report also recommends that the following pages be written in their native language for clarity:
- Product descriptions (67%)
- Product reviews (63%)
- Checkout process (63%)
It is important to note that localization is not just about translation to local languages. This process entails customizing products, content, and user experiences for a specific geographic region. It must take into account local culture, consumer preferences, measurement units, currency, legal requirements, and other factors. Different English-speaking countries, such as the United States and the United Kingdom, have distinct word usage features, such as localization or localisation. Therefore, businesses should also pay attention to this point.
Top Micro eCommerce trends to watch
What to Do with Customer Data?
Following the emergence of social media usage as well as diverse marketing methods, access to customer data is easier than ever before. Dealing with this data is a critical aspect of modern business operations, which can significantly impact the success of any business. In fact, data-driven businesses are 23 times more likely to get new clients. Therefore, adopting a structured approach to effectively collect and process customer data to derive valuable insights and actionable next steps.
Collecting without missing
One critical aspect of leveraging customer data effectively is to collect it comprehensively and accurately. The abundance of customer touchpoints across various platforms provides businesses with a plethora of data, from website visits and social media interactions to purchase history and customer service inquiries. At the same time, according to US figures, 82% of customers are willing to share personal data for a better customer experience. Consequently, the challenge for businesses now lies in how to collate and consolidate this data cohesively.

Implementing robust data collection methods and utilizing advanced analytics tools is crucial to capturing diverse sets of customer data. Utilizing customer relationship management (CRM) systems or customer data platforms (CDPs) can centralize this information, allowing for a more holistic view of customer behavior and preferences. By 2025, the global CDP market share will have increased from $2.4 billion in 2020 to $10.3 billion, indicating the widespread usage of these platforms in customer data collection.
Moreover, the importance of obtaining data ethically and ensuring compliance with data privacy regulations cannot be overstated. With the General Data Protection Regulation (GDPR) and other similar regulations in place, businesses must prioritize data security and transparency in their data collection practices to build and maintain trust with customers.
Process data to obtain valuable insights and next steps
Once businesses have collected customer data comprehensively, the next crucial step is to process and analyze this data to extract meaningful insights.
Advanced data analytics and machine learning techniques play a pivotal role in processing vast datasets to uncover patterns, trends, and correlations that can inform strategic decision-making. 91.9% of organizations reported achieving measurable value from data and analytics investments in 2023. Meanwhile, 49% of companies use data to enhance and improve the customer experience. These figures demonstrate the increasing importance of data-driven decision-making.
By segmenting customers based on their behavior, preferences, and demographics, businesses can tailor their marketing strategies, product offerings, and customer experiences. Predictive analytics enables businesses to anticipate future trends and customer needs, allowing for proactive planning and targeted marketing initiatives.
The insights derived from customer data should be used to formulate actionable next steps. This might involve refining product features, optimizing marketing campaigns, improving customer service offerings, or even innovating new products or services based on identified market gaps. Companies that use customer analytics are more than twice as likely to outperform their competitors in sales, profits, and market share.
Personalization Being Done Right with AI/ML
Following the dominance of the AI/ML trend, the year 2023 witnessed a revolution in the level of customization and tailored experiences provided by eCommerce businesses to customers. AI and ML algorithms have enabled companies to process vast amounts of customer data and identify patterns and behaviors to create highly personalized interactions across various touchpoints in the customer journey.
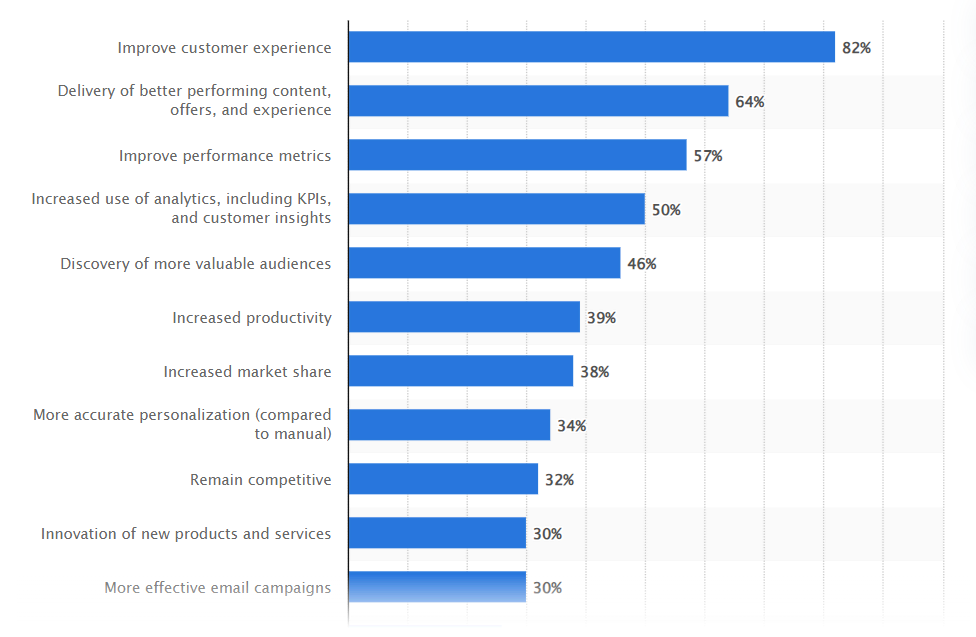
The strength of AI and ML in personalization lies in their ability to analyze complex data sets, enabling businesses to understand customer preferences, behaviors, and purchase history on a granular level. This allows for the creation of hyper-personalized recommendations, content, and experiences that resonate with individual customers. According to Statista, 82% of businesses agreed on adopting AI for marketing customization to improve customer experience. Meanwhile, 79% of retail organizations reported investing in personalization technologies. This is higher than in any other industry, suggesting that retailers stand to benefit the most from customization.
AI-driven personalization extends beyond product recommendations. It encompasses personalized email marketing, website experiences, targeted advertisements, and even customer service interactions. This is crucial as 77% of customers demand a more personalized customer experience. By leveraging predictive analytics, businesses can anticipate customer needs and preferences, delivering the right message or product to the right person at the right time, significantly enhancing engagement and conversion rates. It is reported that 91% of customers are more willing to purchase from brands that deliver relevant offers and suggestions to them.
However, successful implementation of AI/ML-powered personalization requires more than just algorithms; it requires a comprehensive understanding of ethical data usage, transparency, and building trust with customers. Businesses must prioritize data privacy and security while being transparent about how customer data is being utilized to create personalized experiences.
Furthermore, continuous optimization is key to effective AI/ML-driven personalization. By collecting real-time feedback, analyzing performance metrics, and adapting strategies accordingly, businesses can refine and improve their personalization efforts over time, ensuring relevance and resonance with their audience.
Omnichannel to Maximize Revenue
With the customer’s demand increasing significantly, they expect a cohesive and integrated experience, regardless of the channel they choose to interact with a brand. This approach refers to the seamless integration of multiple channels, including physical stores, websites, mobile apps, social media, and more – to create a unified and consistent shopping experience for customers across all touchpoints. According to McKinsey, 60% of customers prefer participating in omnichannel shopping.
The importance of leveraging omnichannel selling in eCommerce cannot be overstated. According to Omnisend, marketing campaigns utilizing a minimum of three channels yield a 494% higher order rate, in comparison to those launching on a single channel. Brands with effective omnichannel customer engagement see a 9.5% yearly increase in annual revenue, compared to a 3.4% increase for brands with poor omnichannel strategies.
Delivering a mobile-first approach is one way to initiate omnichannel selling. Data from RetailMeNot concluded that 69% of consumers used their mobile devices to check products at home, with 53% having used their smartphones to check reviews before chatting to a store employee. It is projected that by the year 2024, mobile commerce will constitute 40.4% of total eCommerce sales; and by 2025, mobile sales will account for 10.4% of all retail transactions.
To establish an effective omnichannel strategy, businesses can consider integrating inventory management systems across all channels. This enables businesses to have real-time inventory visibility, thus preventing issues such as out-of-stock situations. At the same time, customers are allowed to access products from whatever channels they use, reducing the risk of losing sales due to unavailability.
Businesses can also implement consistent pricing, promotions, and messaging across all channels creating a unified brand experience. Customers appreciate coherence and consistency in their interactions with a brand, leading to increased trust and loyalty. One way to achieve this is by leveraging Headless CMS. 82.9% of companies reported that switching to a Headless CMS positively impacted their revenue/growth.
ERP – CRM to Minimize Costs
Cost minimization is critically important for optimized business operations. Enterprise Resource Planning (ERP) and Customer Relationship Management (CRM) are two common solutions that offer a multitude of benefits, ranging from streamlining processes to enhancing customer relationships, ultimately contributing to cost reduction and improved efficiency.
ERP systems are instrumental in managing various business processes by consolidating these functions into a single, centralized platform. According to recent studies, this system is responsible for 23% of operational cost savings for businesses. 95% of companies witnessed significant improvement in business performance after implementing ERP software.
By enabling all divisions to work within the same platform, businesses can eliminate redundancies, improve data accuracy, and make more informed decisions. According to Learn 2G, 28% of organizations reported positive ROI within a year of ERP adoption, 58% within two years, and 15% in more than three years.

On the other hand, CRM systems focus on managing customer interactions and relationships. Given that a poor customer experience results in 65% of customers leaving the brand, delivering excellent customer relationship management is essential for any business. Statistics show that 68% of customers are willing to purchase more from brands that provide good customer experiences. Therefore, CRM tools and strategies are essential in the eCommerce industry.
CRM systems can provide businesses with useful insights into consumer behavior, preferences, and purchase history. 74% of businesses reported that CRM tech gives them better access to customer data. Leveraging CRM data allows businesses to segment customers effectively, tailor marketing efforts, and deliver personalized experiences. According to studies, organizations that use CRM systems see a 300% boost in conversion rates and a 29% rise in income. A properly implemented CRM system can give a 245% ROI to firms.
Given that paperwork and communications are some of the most time-consuming duties in a variety of firms, technologies like CRM software — which is meant to organize, digitize, and automate the majority of company procedures — may make a significant difference. It is reported that CRM software can boost sales by 29%, productivity by 34%, and forecast accuracy by 42%. This improvement results in a 74% increase in customer satisfaction and a 73% improvement in business efficiency.
The integration of ERP and CRM systems is invaluable for eCommerce businesses. As the statistics demonstrate, investing in ERP and CRM systems not only brings significant cost savings but also drives productivity and profitability in the competitive landscape of eCommerce.
Increasing Customer Support Service Quality
Enhancing customer support service quality is a critical aspect of maintaining customer satisfaction and fostering loyalty in the eCommerce landscape. A poor customer experience in support services causes 78% of customers to abandon a transaction. On the other hand, 89% are willing to make another purchase after a positive customer service experience. These statistics underscore the significance of exceptional customer support in driving positive customer experiences.
Response time still stands as the most important aspect of an excellent customer support service. According to HubSpot, an immediate response to a customer service query is rated as essential or very important by 90% of customers, while 60% of customers agree that the optimal immediate response time is 10 minutes or less.
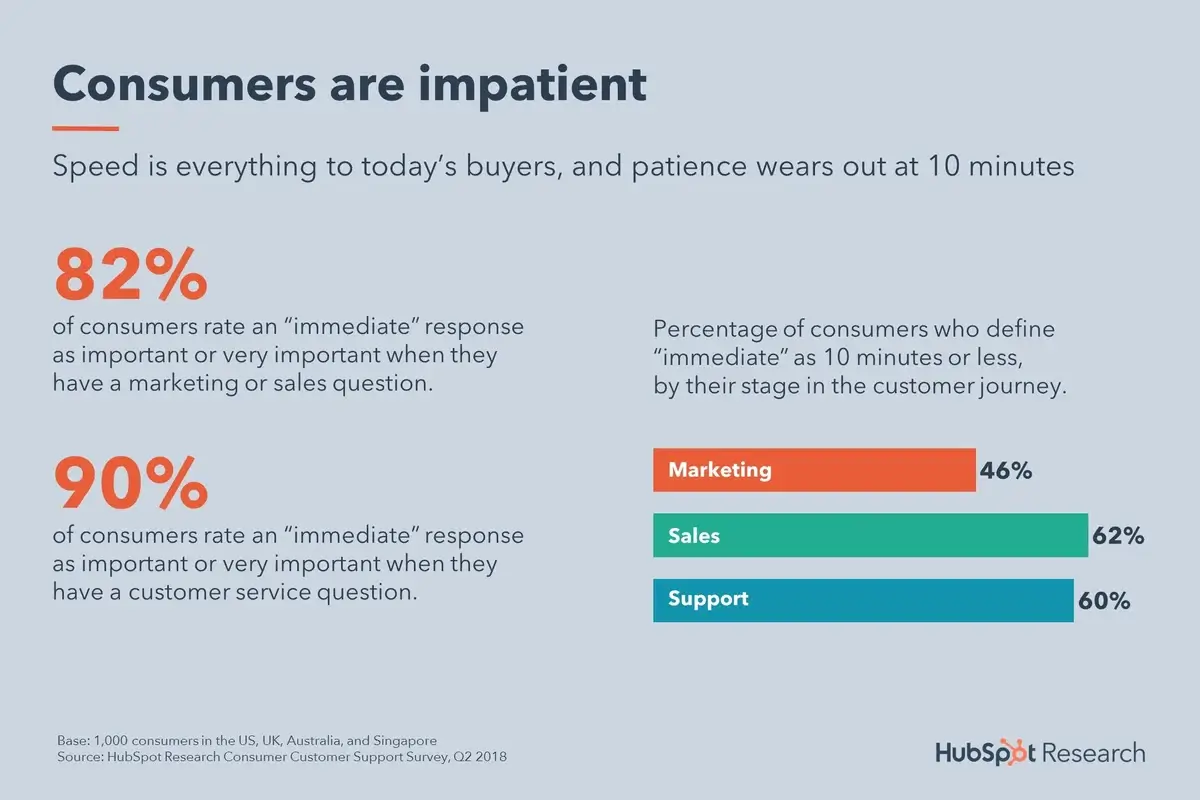
Due to customer expectations for immediate response, live chat has emerged as the favored method of customer support. More than 30% of customers expect live chat on any website they visit and 38% of them are more likely to make a purchase from those brands. Most problems on live chat are resolved in 42 seconds. According to statistics, 86% of live chat tickets end with a satisfied customer. At the same time, 79% of businesses have reported experiencing a positive increase in sales, revenue, and customer loyalty by offering live chat support.
Additionally, leveraging technology such as chatbots and AI-powered assistants can augment customer service capabilities for businesses. These tools have the capacity to offer immediate responses to routine inquiries, guide customers through basic troubleshooting, and free up human agents to handle more complex issues. As a result, they can enhance the overall efficiency and responsiveness of customer support, contributing to improved service quality.
PWA & Headless eCommerce
In the realm of micro eCommerce trends for 2023, the adoption of Progressive Web Applications (PWAs) and Headless eCommerce architecture stands out as a transformative force reshaping the digital commerce landscape.
PWAs represent a cutting-edge approach to web development. It combines the best of both web and mobile app functionalities, offering a seamless, app-like user experience. On average, a website using PWA can improve speed by 63%. The average loading time of PWA sites is only 2.75s. Businesses also reported experiencing an increase in monthly organic traffic from 14% to 630%.
Apart from faster load times, PWA offers customers native app-like features including offline capabilities, push notifications, and smooth navigation. This approach significantly enhances user experience, ultimately driving higher conversion rates for online businesses. Studies show that businesses implementing PWAs witness a 50% reduction in bounce rate and a 52% increase in conversion rates. This figure underscores the substantial impact of this technology on improving engagement and sales.
According to BuiltWith data, more than 54,097 websites used PWAs in October 2023. Despite a large number of websites being used globally, PWAs are still expected to have immense potential for further adoption. It is estimated that by 2027, the PWA market will be valued at $10.44 billion, highlighting the growing popularity and adoption of this technology.

The emergence of Headless eCommerce architecture has also revolutionized the way eCommerce platforms are built and managed. Headless architecture brings an innovative approach by decoupling the front-end presentation layer from the back-end commerce functionalities. This structure allows for greater flexibility and agility in delivering content across various devices and channels.
Headless architecture enables businesses to create unique and tailored customer experiences by allowing more freedom in the presentation layer. It is agreed by 77% of organizations that this architecture enables faster changes to their storefronts, while 66% said that it improves integration between systems. Additionally, Headless eCommerce allows for faster innovation cycles, enabling businesses to adapt swiftly to changing market demands and customer preferences. Reports indicate that 76% of companies leveraging Headless eCommerce experience increased agility and a faster change implementation process.
The synergy between PWAs and Headless eCommerce architecture empowers businesses to offer highly engaging, fast, and personalized shopping experiences while ensuring adaptability and scalability in a rapidly evolving digital landscape. By embracing these technologies, eCommerce businesses can position themselves at the forefront of innovation, delivering exceptional user experiences and staying competitive in the dynamic world of online commerce.
Conversion Rate Optimization
It’s no longer enough to drive more website traffic in order to increase revenue. To truly increase sales, you must optimize your website experience to convert more of your visitors. For this reason, Conversion Rate Optimization (CRO) still stands as an emerging trend for businesses seeking to drive higher conversion rates.
CRO encompasses a range of techniques and methodologies aimed at improving specific elements of a website or digital platform to encourage visitors to take desired actions. This involves analyzing user behavior through tools like heatmaps, A/B testing, and user journey analysis to identify bottlenecks and areas for improvement in the conversion process.
CRO focuses on enhancing the user experience, refining website elements, and leveraging data-driven insights to optimize the conversion funnel. An effective CRO implementation can increase conversion rates by 5-10%. By leveraging data and insights gained from user behavior analysis, businesses can implement strategic changes to their website design, user interface, content, and call-to-action (CTA) placements, which all have a significant impact on conversion rates.
The year 2023 witnessed some dominant trends in CRO. Standing at the top CRO trends every year, personalization plays a pivotal role in conversion rate optimization. With 77% of customers demanding a more personalized customer experience, businesses should focus on delivering tailored content, product recommendations, and offers based on user preferences and behavior to enhance engagement and conversion rates.
Cart abandonment rates are still high across the globe, recorded to be 68.7%, 57.9%, and 55.9% in the US, UK, and Europe respectively. Therefore, simplifying the checkout process remains a concerning issue in CRO for eCommerce businesses. Findings from Capterra’s online shopping survey indicated that two-thirds of customers expect this process to be 4 minutes or less, and 28% expect it to happen in just 2 minutes. Businesses should begin by analyzing the checkout process and looking for areas that can be optimized, such as too much-required information or a complex payment gateway, in order to reduce the time customers spend on this process.
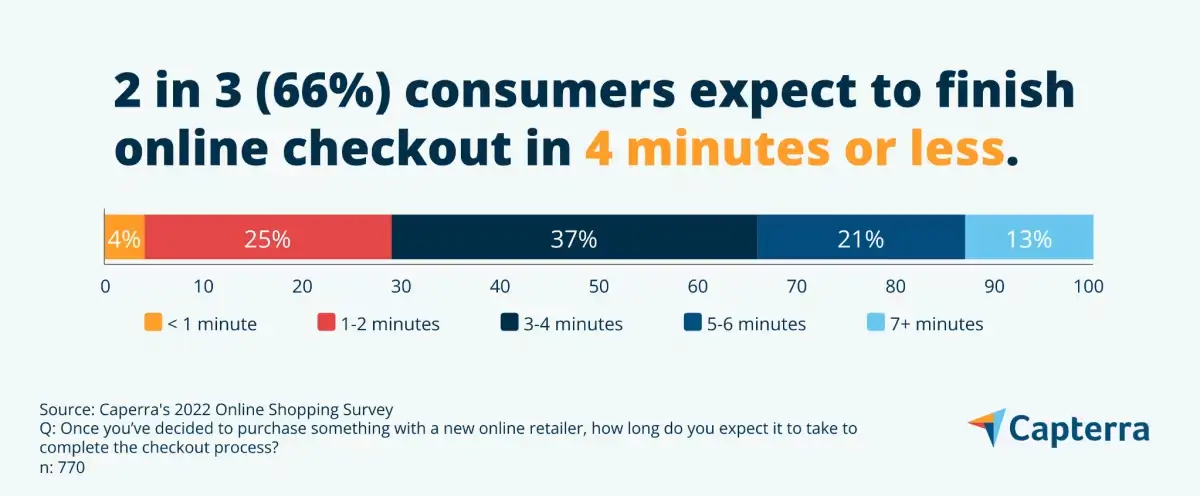
Influenced by the macro trend of the mobile-first approach, delivering a mobile-friendly website is a common CRO method in 2023. With 40% of online transactions from mobile devices, having a mobile-optimized website is crucial in creating a positive customer experience, thus increasing conversion rates for your stores. To capitalize on this trend, businesses should start by integrating responsive design into their websites. In this way, customers can enjoy a seamless shopping experience on whatever screen sizes they use.
In the highly competitive eCommerce landscape, CRO remains a vital trend not only in 2023 but also in the upcoming years. As statistics demonstrate, investing in CRO initiatives yields substantial improvements in sales and customer acquisition, empowering businesses to unlock the full potential of their existing traffic and drive more conversions.
Voice Search
The number of voice search users as of 2023 is reported to be 125.2 million, indicating the popularity of this eCommerce trend. It has emerged as a transformative force reshaping the way consumers interact with digital platforms and search for products.
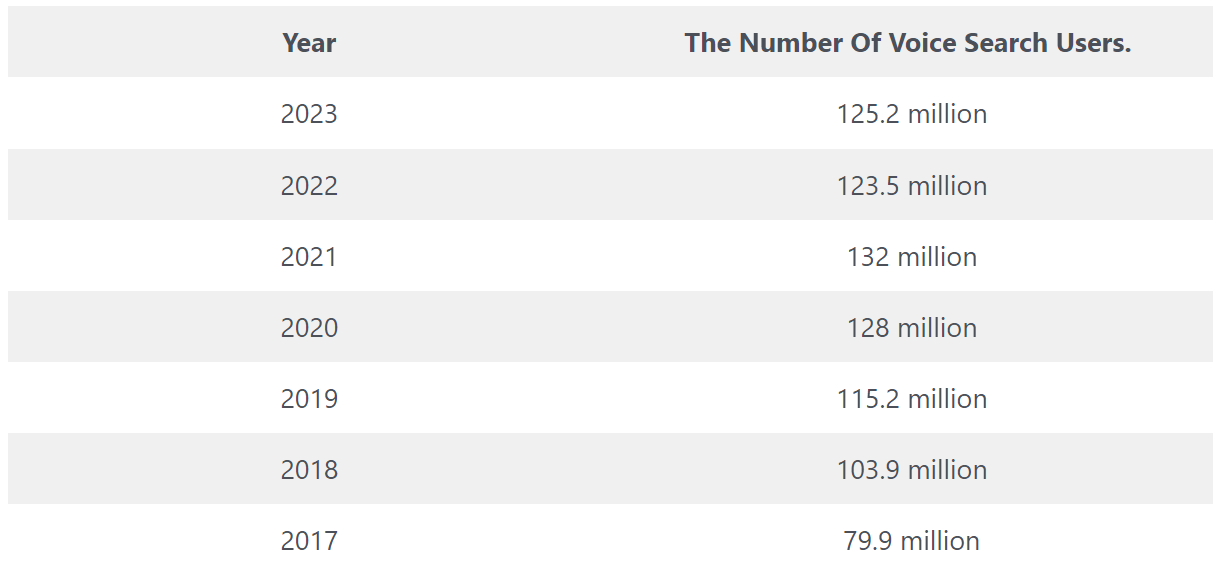
Voice search technology enables users to conduct searches and interact with digital devices through spoken commands or queries, bypassing the traditional text-based search methods. Consumers are increasingly adopting voice search for its convenience, speed, and hands-free nature. 34% of U.S. residents reported using voice search at least once a week, while 50% of them use it in their daily lives.
The increasing usage of smartphones and mobile devices also leads to the growth in voice search usage. According to statistics, 77% of adults aged 18 to 34 use voice search on their smartphones. In contrast, 63% of adults aged 35 to 54 use voice assistants on their mobile devices.
For eCommerce businesses to best capitalize on this trend, you should tailor your content, product descriptions, and SEO strategies to align with natural language queries that users are likely to speak rather than type. This includes focusing on long-tail keywords, and conversational phrases, and answering specific questions that users may ask their voice assistants when searching for products or information.
Moreover, providing concise and accurate answers to common questions related to products, shipping, or customer service through FAQs or dedicated Q&A sections on websites can also improve visibility in voice search results. Creating content that addresses user queries effectively not only enhances the user experience but also increases the likelihood of being featured in voice search snippets.
Furthermore, optimizing for local voice search is crucial for businesses with physical stores. Incorporating location-based keywords, optimizing Google My Business profiles, and ensuring NAP (Name, Address, Phone number) consistency across online directories can enhance visibility in voice searches for local products or services.
Subscription Models
According to statistics, 54% of online shoppers subscribe to an eCommerce subscription box service while about 15% have subscribed to an eCommerce subscription service within a year. Moreover, it is forecasted that the subscription eCommerce market will reach $38 billion by the end of 2023.
These statistics have indicated the domination of the subscription model in the eCommerce market. This model works by offering customers regular access to products or services through recurring payments, thus providing convenience, cost-effectiveness, and a personalized experience. Businesses implementing subscription models benefit from recurring revenue streams, enhanced customer retention, and the opportunity to build long-term relationships with customers.
However, the churn rate is still a significant challenge for subscription companies. This is an important metric that describes how many existing customers are unsubscribing from the company. For membership companies to grow, their churn rate must be lower than the rate they acquire new customers. The average subscription churn rate is reported to be at 5.6%. Meanwhile, SaaS companies saw the lowest churn rate, at 4.79%.
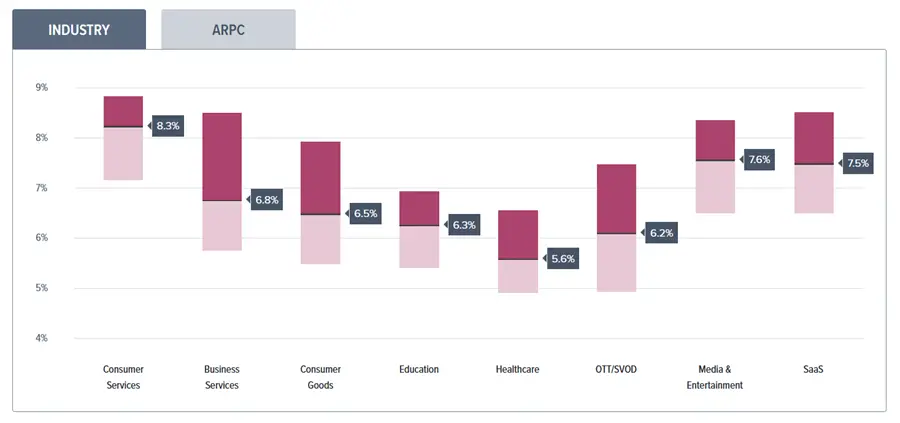
Among the strategies to promote subscriptions, free trials stand out as the most significant one for eCommerce businesses. According to statistics, free trials converted 61.7% of consumers from the first to the second month. Another study indicates that free trials contribute to 66% of B2B conversions.
At the same time, incentive offering is another widely used method by many companies to retain customers when they attempt to cancel a subscription. According to reports, offering incentives during the cancellation process can reduce cancellations by 32%. Among these, discounting is the most effective incentive method, with 49.13% of customers retained using this method. Giving customers account credit, offering a downgraded plan, and pausing plans are also effective retention methods, with 28%, 25%, and 26% of customers retained, respectively.
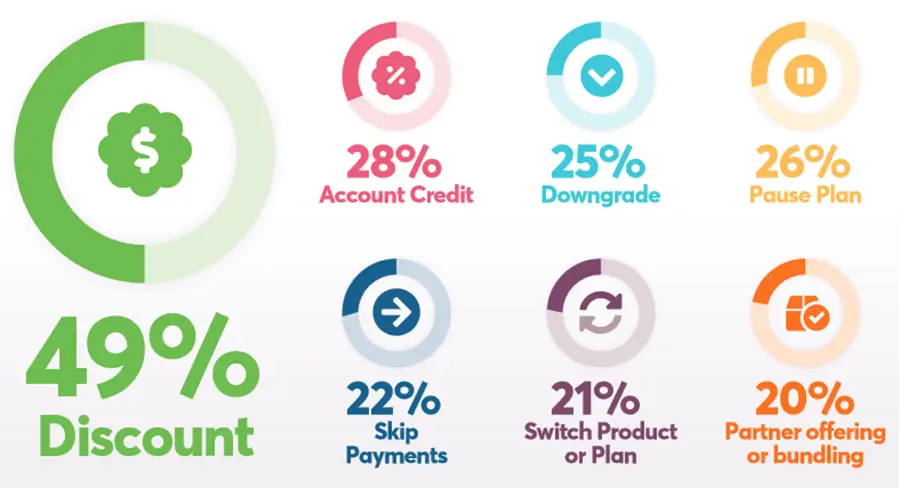
One factor consumers consider when subscribing to a new product or service is the ease of cancellation. It is reported that 80% of consumers are more likely to try or buy a new subscription if they could cancel it online. Meanwhile, 80% of customers also claimed that they would be less likely to repeat their purchase for a company that provides them with a negative experience during the cancellation process. Therefore, companies should also consider delivering a simple and easy cancellation process to reduce the churn rate effectively.
Diverse Payment Options
In the fast-paced world where customer preferences are diverse and changing rapidly, offering diverse payment options has become a must for businesses aiming to enhance customer satisfaction and increase conversion rates. Statistics reveal that nearly 50% of consumers abandon their online purchases if their preferred payment method is not available, highlighting the significant impact of diverse payment options on the shopping experience and conversion rates.
Consumers today expect flexibility and convenience when it comes to making payments online. Hence, eCommerce businesses are increasingly diversifying their payment options to accommodate various preferences, including credit and debit cards, digital wallets, bank transfers, Buy Now, Pay Later (BNPL) services, and cryptocurrency payments.
According to the market share of eCommerce payment methods report, digital wallets ranked as the most popular payment method worldwide, accounting for 49% of global eCommerce transactions in 2022. This figure is expected to reach 54% by 2026. Credit cards ranked second with a 20% market share, a figure which is projected to decline in the coming years.
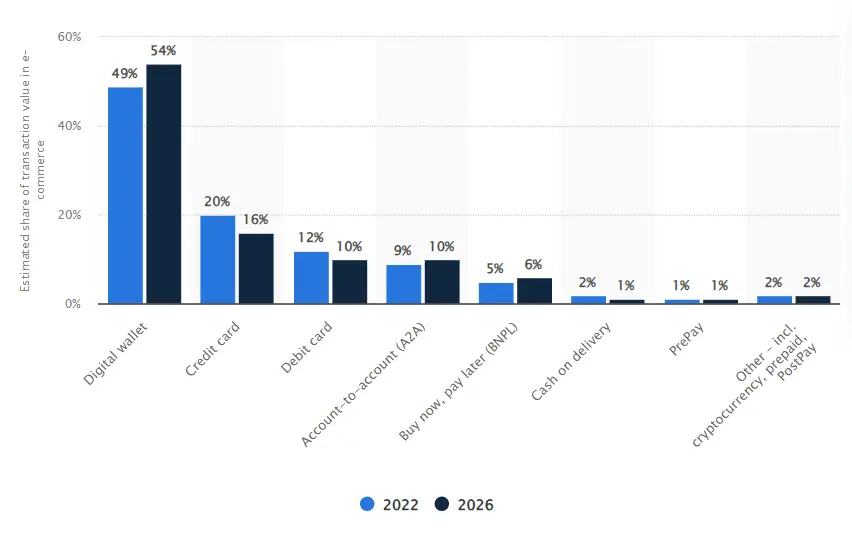
By offering a wider array of payment methods, eCommerce businesses can cater to a broader audience, reduce checkout friction, and increase the likelihood of completing transactions. For instance, digital wallets like PayPal, Apple Pay, or Google Pay provide a seamless and secure checkout experience, appealing to customers looking for speed and convenience.
Moreover, integrating BNPL services has gained momentum in eCommerce, especially among younger demographics. Recent data shows that 60% of people have experienced BNPL services while 46% are currently making a payment via this method. Among those, Gen Z is the generation that uses BNPL the most. The adoption rates among this generation are projected to reach 47.4% by 2025. Therefore, businesses incorporating this option can expect an increase in average order values and higher conversion rates among customers preferring this payment method.
Free, Fast & Convenient Delivery Service
The delivery offer is part of the checkout process, which is the last step before customers complete their online shopping experience. Before the final step of their shopping journey, many customers would prefer to choose merchants who offer the most convenient, cheapest, and fastest delivery option.
According to the eCommerce Delivery Benchmark Report by Metapack, the top 3 priorities of consumers when considering online shopping include cost of delivery (27.4%), speed of delivery (26.6%), and convenience of delivery (23%). Therefore, a low-cost delivery option is no longer the first choice of customers.
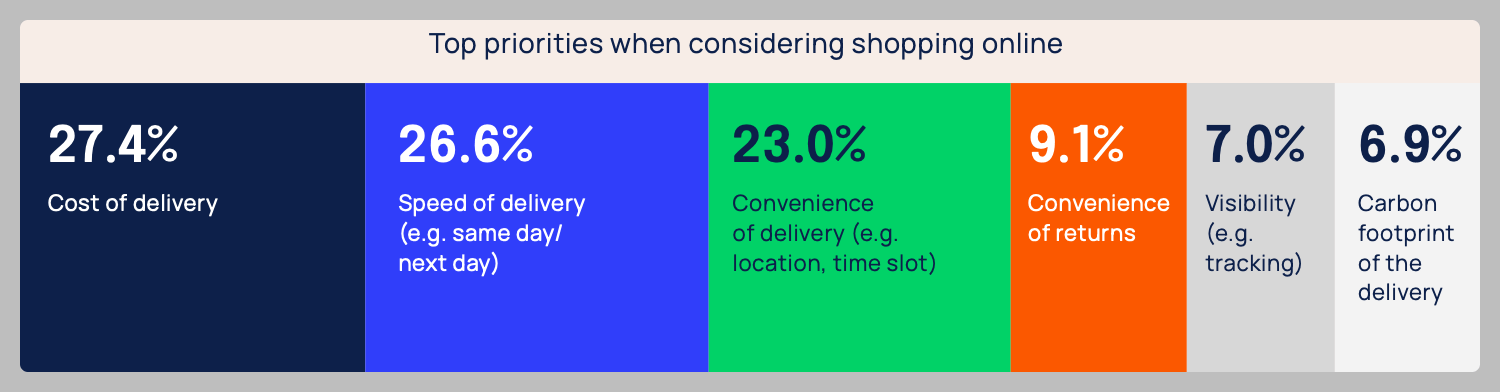
Moreover, data from the Baymard Institute’s card abandonment research indicated that high extra costs, including delivery costs, are the main reason customers abandon their cart, accounting for 47%. This highlights the importance of offering transparent delivery costs so that they’re not a surprise once buyers go to checkout.
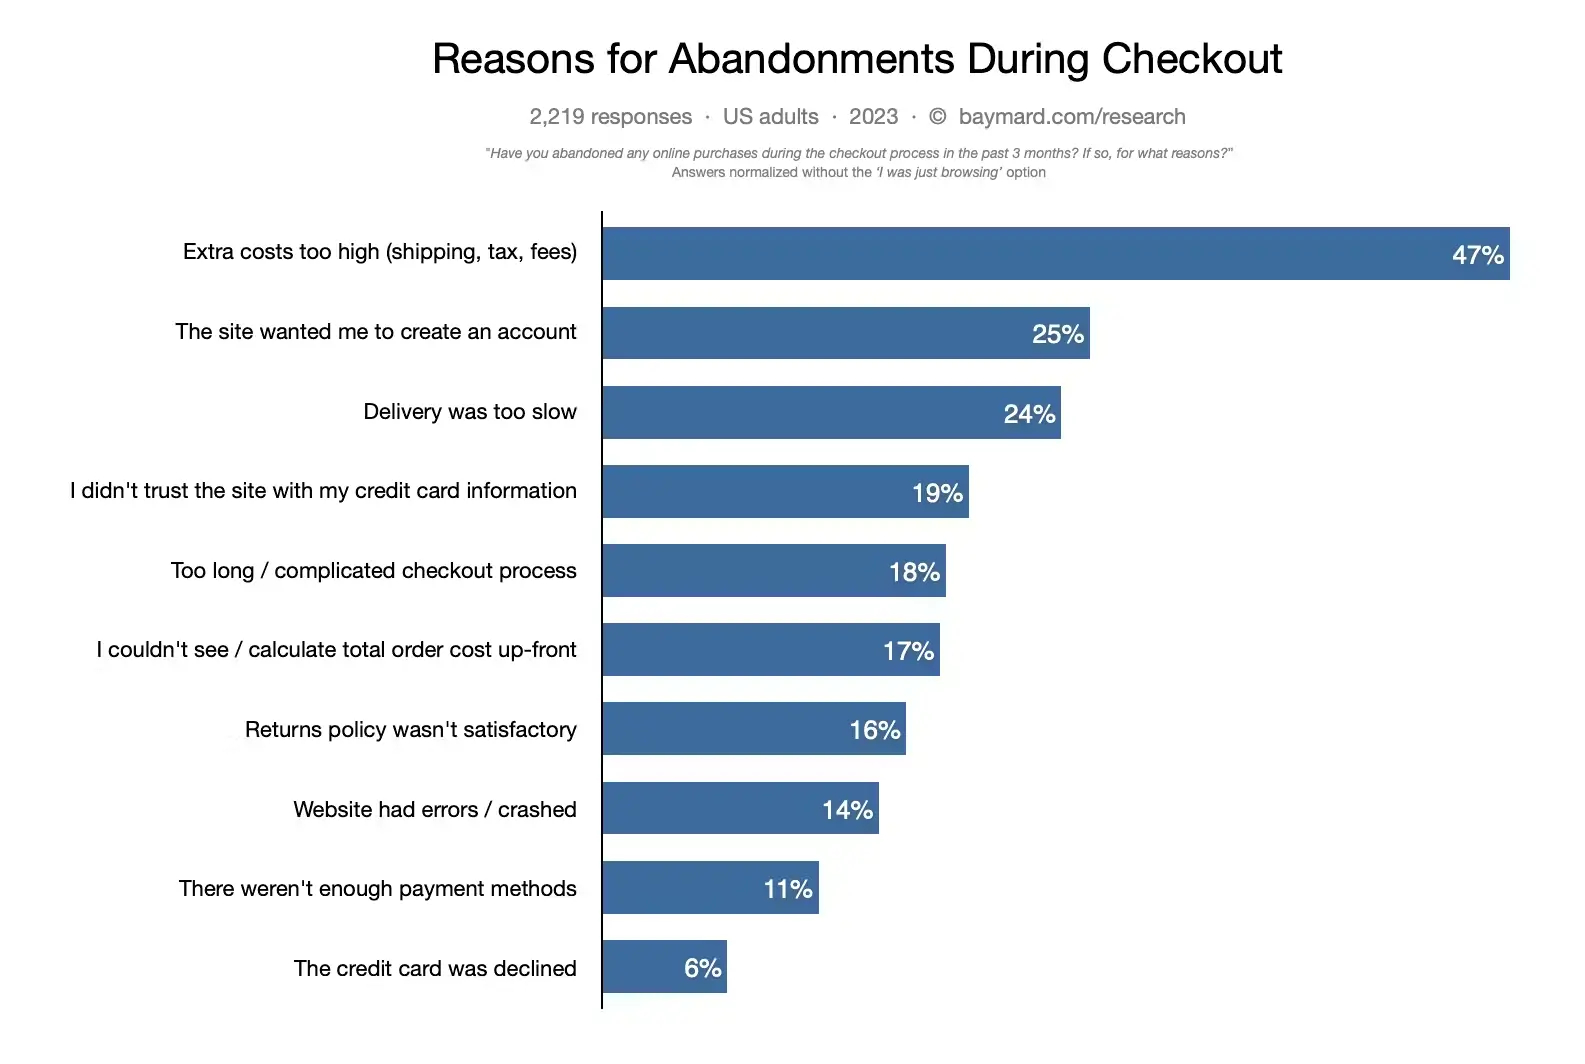
It can be concluded that customer’s expectations for delivery services today are effortless, dynamic solutions at every stage of the process. This includes easy checkout flow, intelligent last-mile flexibility, and accurate delivery promise that make it a success.
To meet these expectations, your eCommerce delivery strategy should be far more sophisticated than simply offering free shipping on all orders. You can start by establishing effective partnerships with logistics providers, optimizing warehouse operations, and strategically locating fulfillment centers to enable quicker order processing and delivery. Additionally, implementing order tracking systems and real-time delivery updates enhances transparency and fosters confidence among customers.
In addition, businesses may utilize subscription-based models or loyalty programs to provide free shipping, thereby motivating clients to increase the value and frequency of their purchases. By integrating free shipping into a membership or loyalty program in a strategic manner, your business may increase foster customer loyalty and promote recurring sales.
In Conclusion
In the dynamic landscape of eCommerce, the year 2023 unfolds with a myriad of trends and statistics that shape the way businesses engage with consumers and navigate the digital marketplace. It is critical to remain current with the eCommerce industry in order to successfully navigate this market.
In this article, we have guided you through appealing eCommerce statistics 2023 regarding macro and micro trends, the market as a whole, consumer behavior, mobile shopping, and social media marketing. We have also furnished recommendations on how to optimize returns by utilizing each statistic.
The aforementioned statistics, reports, and data indicate that eCommerce remains an absolute necessity for any business. It might determine the future success of your organization. This article has hopefully facilitated your comprehension of the current state and future trajectory of the industry.
If further inquiries arise or if you require support in the establishment and development of your eCommerce businesses, you are more than welcome to reach out to our specialists for more advanced consulting services.