
Now is an excellent time to start an eCommerce business, as more and more people are shopping online. To make informed decisions for your business, it is essential to stay up-to-date with the latest eCommerce statistics and trends.
Since market research can be quite time-consuming, we have decided to do the work for you and provide eCommerce statistics that will help your business get the preparations for 2023. In this article, we’ll explore interesting eCommerce stats related to an overview of the market, online shopper statistics, mobile commerce, eCommerce marketing, social media marketing, macro, and micro eCommerce trends. Let’s get started.
Table of Contents
- General eCommerce Statistics
- eCommerce Platform Statistics
- eCommerce Consumer Statistics
- Mobile Commerce Statistics
- Retail mCommerce sales hit $359.32 billion in 2021
- Mobile still dominates online traffic
- Under half of all mobile users use their smartphones to compare product or service prices
- Voice Shopping is estimated to reach $40 Billion in the US by 2022
- QR Code Payment users to reach 2.2 billion globally by 2025
- Top mCommerce apps
- eCommerce Marketing Statistics
- Potential customers want to purchase from online stores that offer live chat support
- 83% of online customers said belonging to a loyalty program influences their decision to buy again from a brand
- 89% of Digital Businesses are investing in personalization
- Email is still an effective marketing tool
- Video Marketing plays an important role in businesses’ marketing strategies
- eCommerce Social Media Statistics
- Social commerce sales are expected to reach $992 billion globally by 2022
- More than a third of the time that internet users aged 16 to 64 spend online is spent on social media
- China Is the social shopping leader
- The number of US social buyers to increase by more than 35%
- Social Commerce is really popular among young people
- Most marketers agree that social data gives them an advantage over the competition
- Consumers see authenticity as a key factor in choosing which brands to support
- Top Macro eCommerce trends to watch
- Micro eCommerce trends
General eCommerce Statistics
Global eCommerce Sales Growth
As eMarketer’s Worldwide eCommerce Forecast Update 2022 report stated, global eCommerce sales will only grow by 9.7% in 2022, a slight decline from the previous period. The chart also suggests that this growth rate will continue to slowly decline over the next few years.
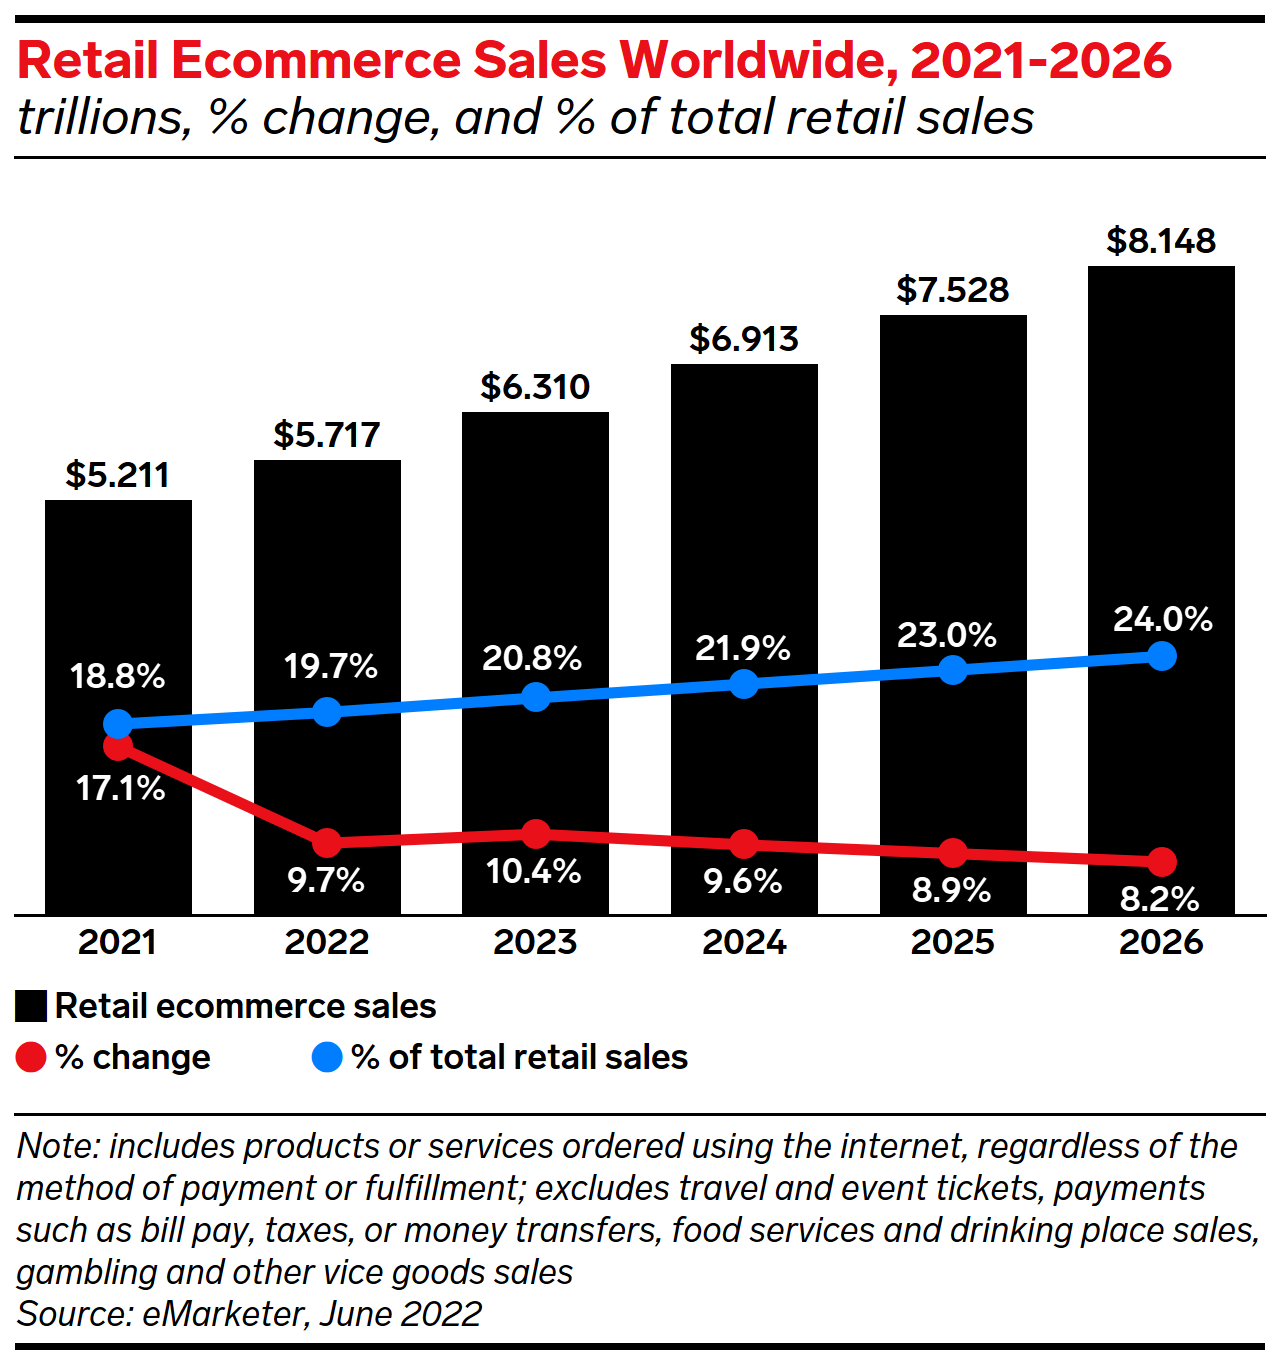
In contrast, the percentage of total retail eCommerce sales looks brighter than the growth rate when the global eCommerce market is expected to reach $5.717 trillion by the end of 2022, as seen in the chart above. Two years ago, only 17.8% of sales were made from online purchases (Global eCommerce Forecast 2021, eMarketer, 2021). That number is expected to grow in the next few years and reach 20.8% by 2023, a 3 percentage point increase. And the growth is forecasted to continue, by 2025, 23% of all sales are estimated to be made online, which would be a 5.2 percentage point increase in five years.
Though retail took a beating in 2020, global sales have been on the rise and continue to claim more market share. eCommerce will total $6.51 trillion by 2023 according to reports from eMarketer and Statista, that’s 22.3% of all retail sales. In fact, every country covered in eMarketer’s Global eCommerce Update 2021 research saw double-digit growth in online shopping last year, signifying that this trend is still here to stay:
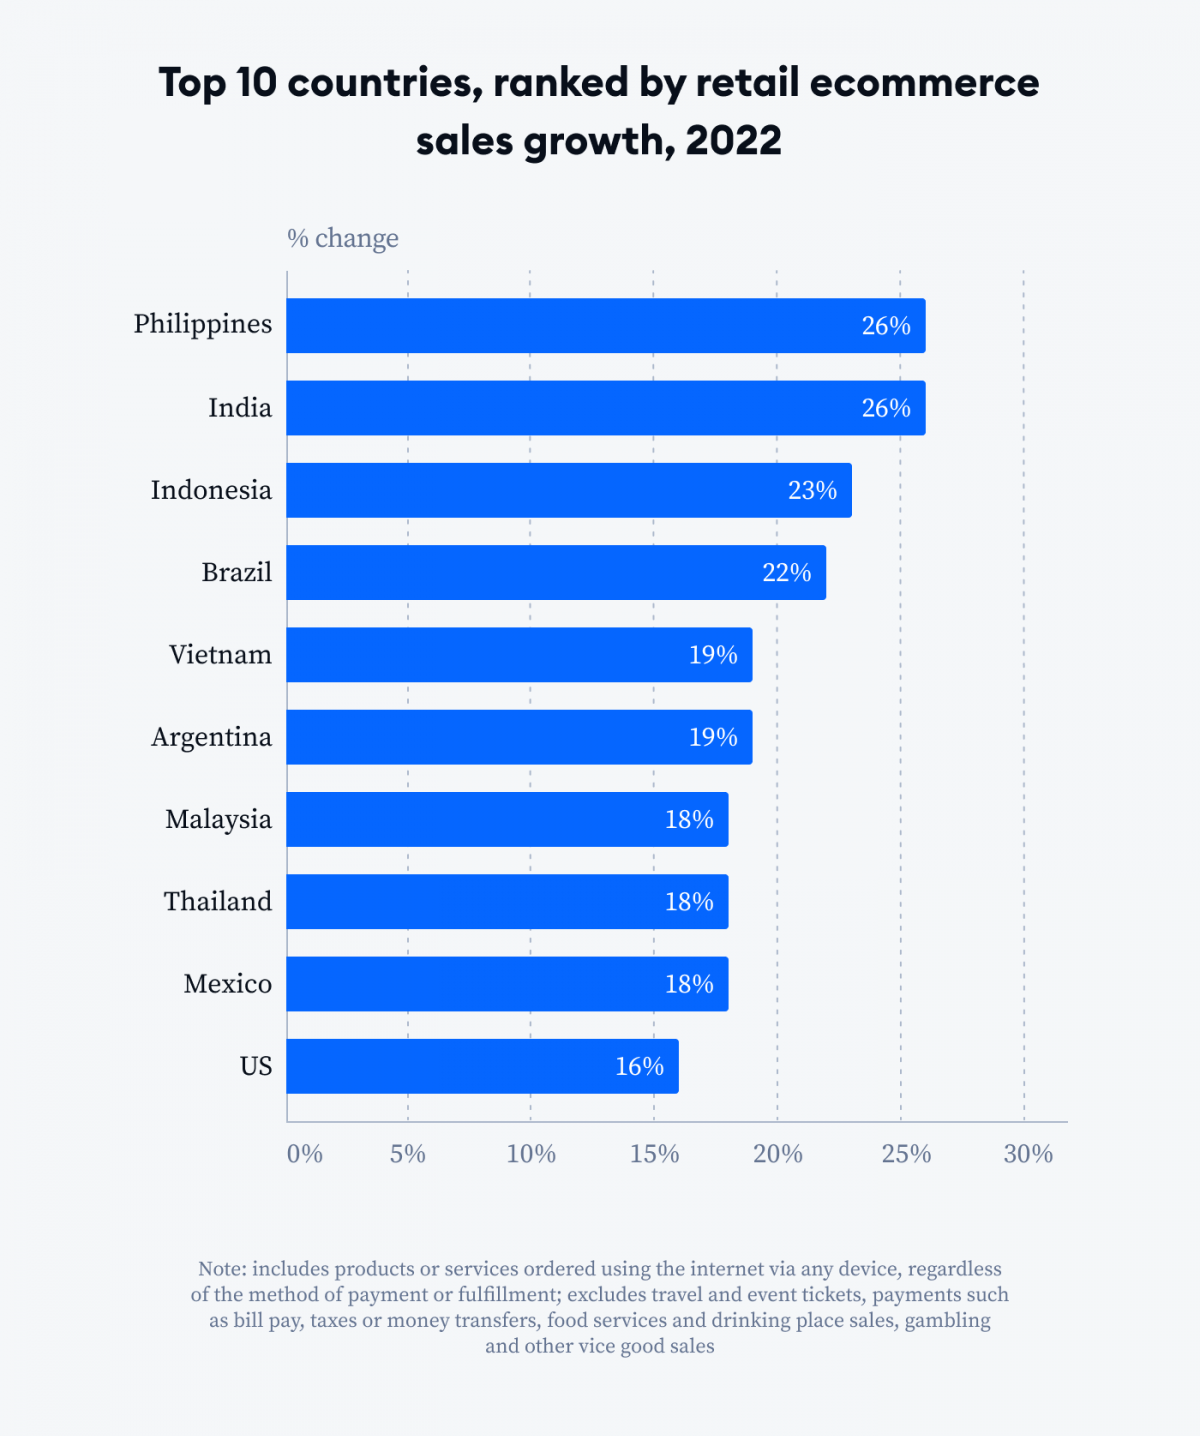
- By 2022, eCommerce sales in Latin America are projected to surpass $104 billion, a 22.4% increase from just $85 billion in 2021.
- India’s eCommerce market is estimated to grow by 25.5% in sales by 2022, making it one of the world’s top 5 fastest-growing countries for this industry.
- Five eCommerce markets are predicted by eMarketer to remain in the top positions until 2025, and these have remained unchanged since 2018.
Even though retail eCommerce sales are predicted to make up a higher percentage of total retail sales in the next few years, the growth rate has actually decreased. You should take notice that development in this area is slowing down much more than it was before; the market is becoming saturated. Don’t just focus on the positive metrics and think everything will stay rosy, the market will reach a stable plateau soon enough. The growth of the retail market largely relies on population expansion and, to a lesser degree, changes in consumer behavior. That’s why we see such high rates of retail eCommerce sales growth in regions like Latin America, South East Asia, India, and China…
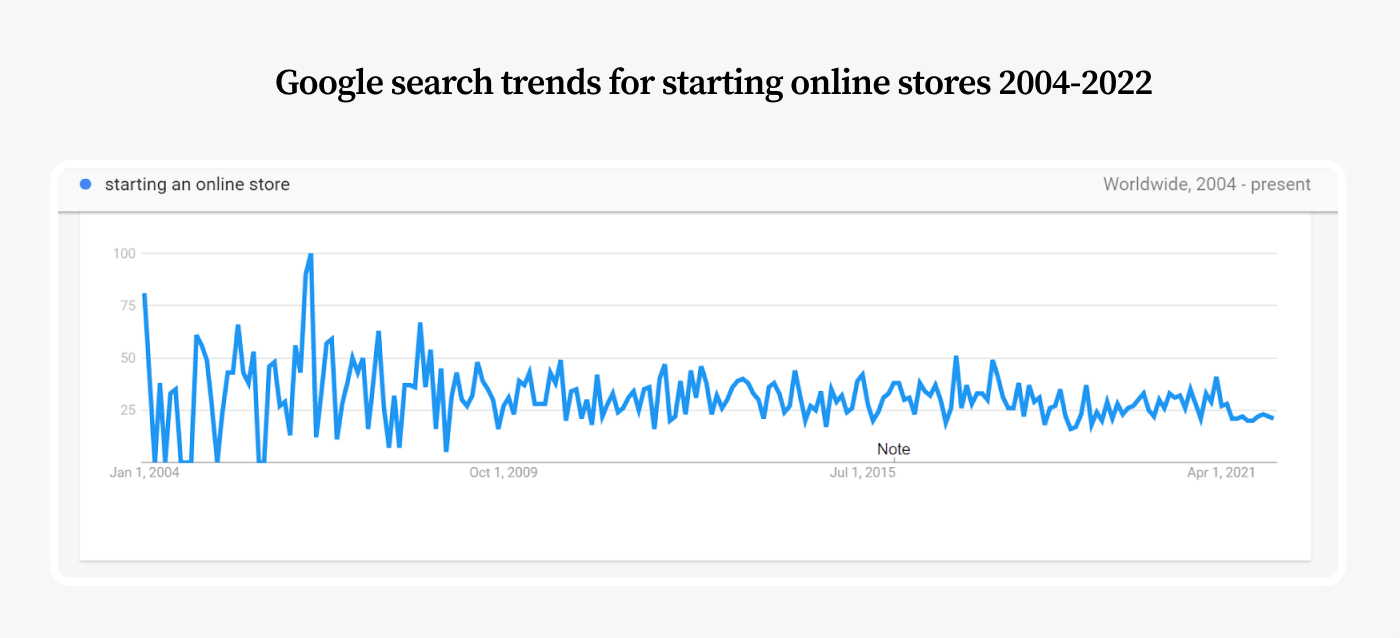
The Growth of Online Stores and Leading Products Categories Purchased
These days, many people love to shop online, and it’s no surprise given the pandemic has limited so many people’s movement. Research suggests that 63% of all shopping journeys now start on the internet.
The number of online sales and their values are increasing. As we mentioned, in 2022, global eCommerce sales are projected to reach over $5 trillion. This growth can be attributed to many factors, such as the rise in mobile shopping, the popularity of social media, and the growing subscription services market.
Entering marketplaces can open up new opportunities for online shops to bring in higher revenues. You can turn one-time customers into regulars by using targeted marketing strategies and giving them a great customer experience.
Currently, the Asia-Pacific region and South America are growing at the fastest pace in terms of eCommerce. This is a result of both the dynamic adaptation to new technologies as well as changes in demographics. In general, younger generations are more comfortable using technology and therefore shop online more frequently than older generations. Additionally, the population growth rate is quite higher in these countries than in Europe or North America.
In contrast, the United States is already a fully developed market for eCommerce for many years. Nevertheless, it’s still ranked in the top ten fastest-growing countries with regard to changes in online sales numbers.
With the increasing popularity of online shopping, businesses have a chance to start selling their products through an eCommerce store. Right now, close to 9.1 million stores are existing online with more emerging every day. Most of these stores use Woocommerce or Shopify as their platform. While this number might seem large and intimidating, people are becoming more comfortable making purchases online which is good news for businesses looking to enter the market.
Additionally, eCommerce stores are pretty good for turning visits into sales. According to Oberlo, around 1.94% of all visits to eCommerce sites result in a sale. But contrary to popular belief, there is no peak in starting online businesses.
Although the number of online stores has increased to meet consumer demand, there is still room for growth. If you’re a business owner, now is your chance to get in on the action and capitalize on this growing trend.
According to the Digital 2022: Global Overview Report, consumer electronics generated more revenue than any other product category in global business-to-consumer (B2C) eCommerce markets, raking in over $988.4 billion. This is about $665.6 billion more than the fashion industry, which held first place in 2021.
Other thriving industries that are growing rapidly include toys and personal and household care, which generate over $381.5 billion in revenue. The food and beverage industries have the fastest growth, showing a 38% and 35% increase in revenue, respectively. Additionally, according to Statista, businesses in the food and beverage industry have an average conversion rate of 5.5%, making it the highest-converting eCommerce vertical.
Other high-converting markets include hair care, beauty and skincare, and health and beauty. The least successful markets are luxury handbags and home furniture, which have average conversion rates of 0.6%.
While the fashion industry ranks second, it still generates revenue of $904.5 billion, making it promising for future years.
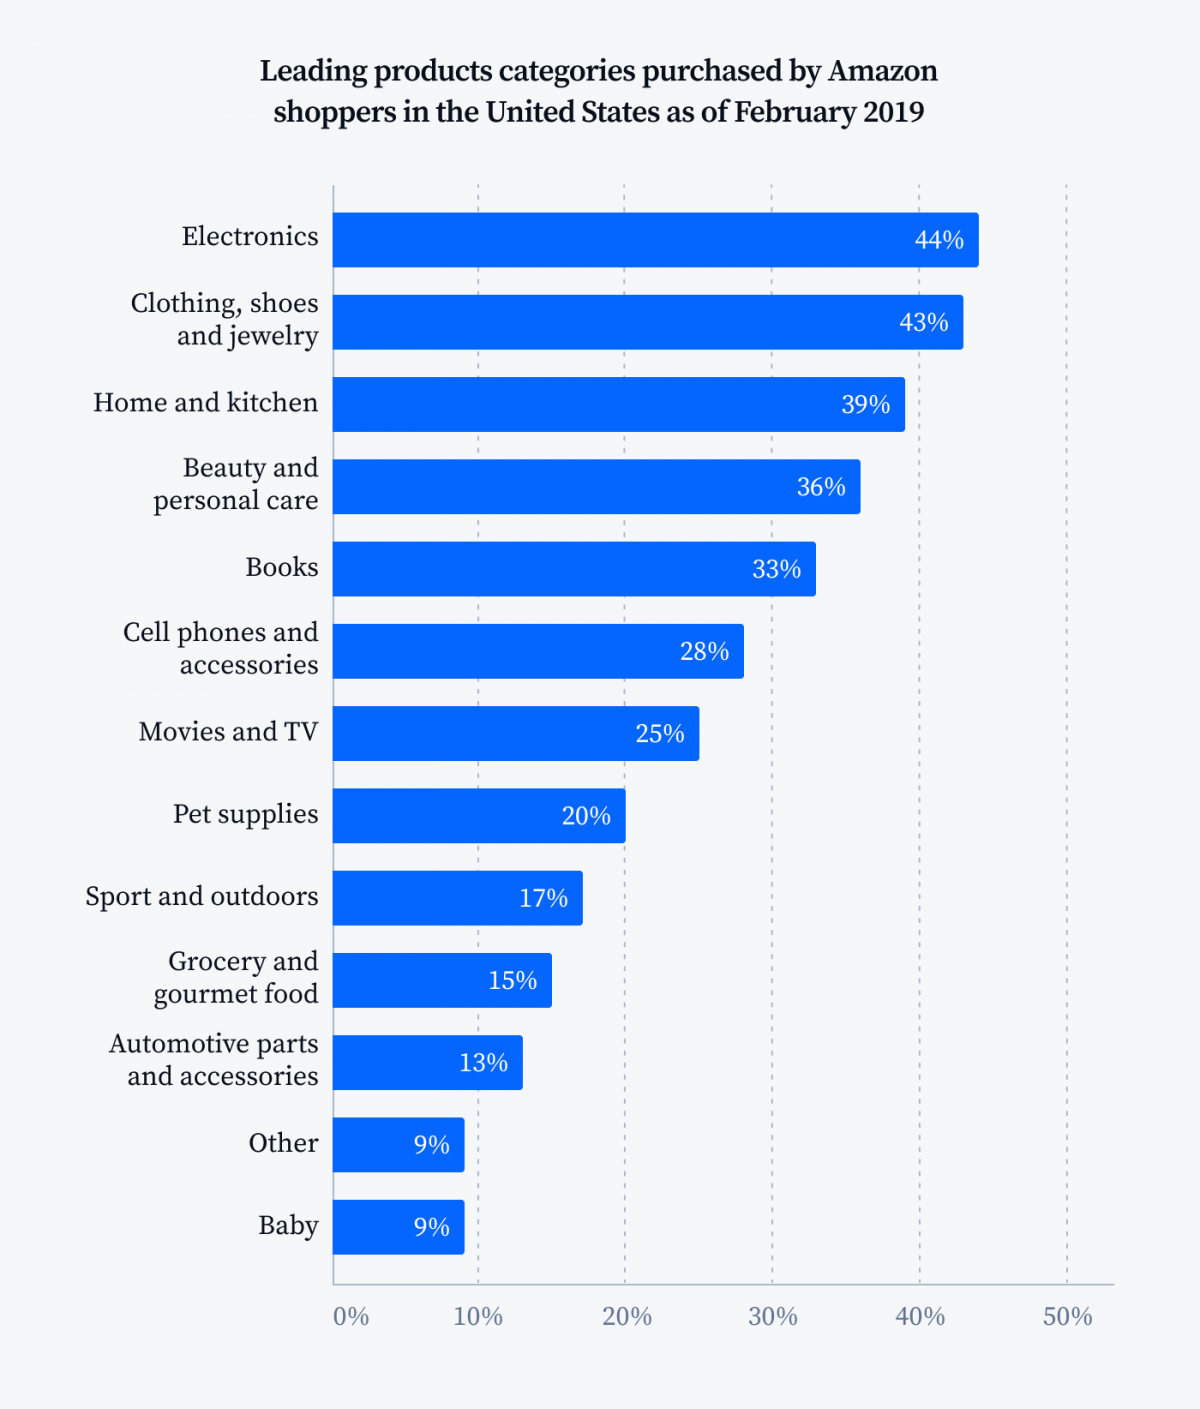
Based on February 2019 research of the top product categories purchased by Amazon shoppers in the US, electronics are the most popular, comprising 44% of customers. Clothing, shoes, and jewelry follow at a close second with 36%. These statistics have remained relatively stable over the years. If you’re thinking about starting an Amazon business or expanding your current one, understanding these trends is crucial because each niche has different standards for metrics such as shopping cart abandonment rates or conversion rates.
The Domination of Amazon in The Global eCommerce Market
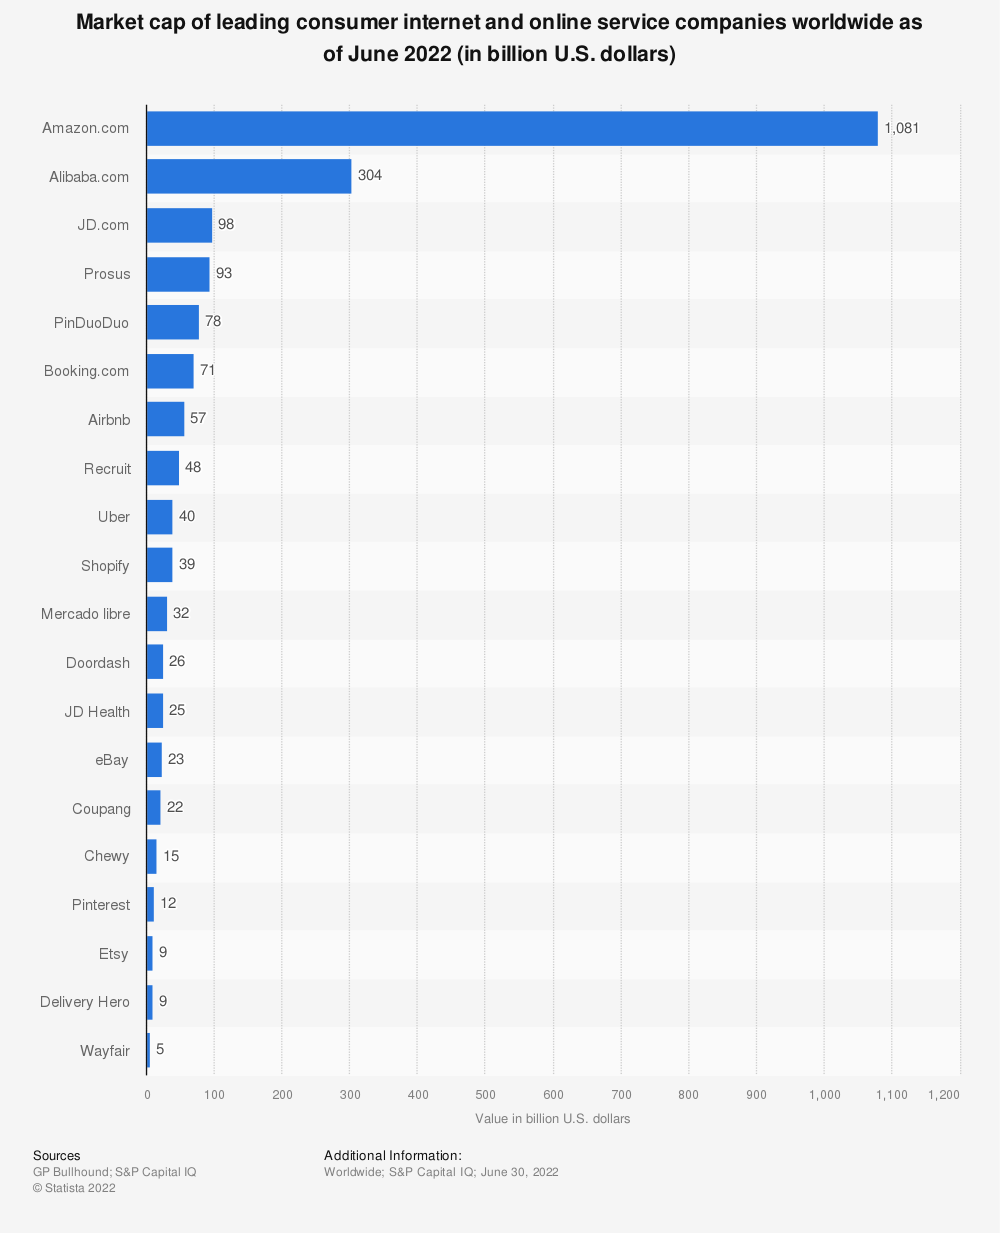
When people hear eCommerce, they automatically think of Amazon. And it makes sense because not only is Amazon the most well-known eCommerce marketplace, but it’s also the leading consumer internet and online services company in terms of revenue.
Amazon is currently the most valuable company in the world, with a worth of just over $1 trillion as of June 2022 (Statista, 2022). The only other competitor that comes close to Amazon is Alibaba, which falls significantly behind at $304 billion.
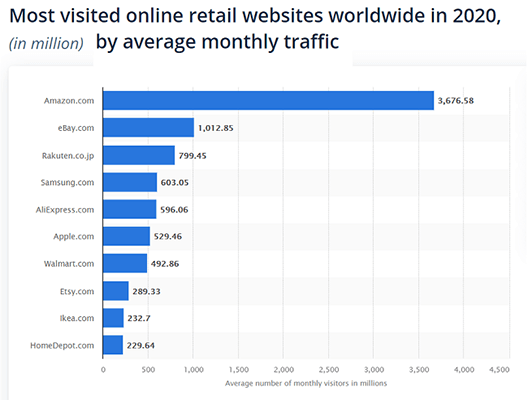
Statista’s Leading online marketplaces worldwide as of July 2020, based on the number of monthly visits chart reports that Amazon is also the most visited online retail store in the world. In only 2020, Amazon recorded an immense 3.6 billion visitors to its site.
The second most popular online retail store is eBay, which had just over 1 billion visitors in 2020. Other well-known eCommerce sites include Rakuten (Japanese) and Samsung (South Korean).
eCommerce Sales by Country in 2022
According to recent research by eMarketer, China will remain the world’s most penetrated eCommerce market in 2022, with 46.3% of the country’s retail sales taking place online. The US eCommerce market is forecasted to reach more than $904.9 billion in 2022, a little over a third of China’s. China’s eCommerce revenue is quite remarkable, especially considering that it only surpassed the US as the world’s largest eCommerce market less than a decade ago. Let’s dive deeper into these two eCommerce markets.
There are over 230.5 million US shoppers buying goods and services online in 2022
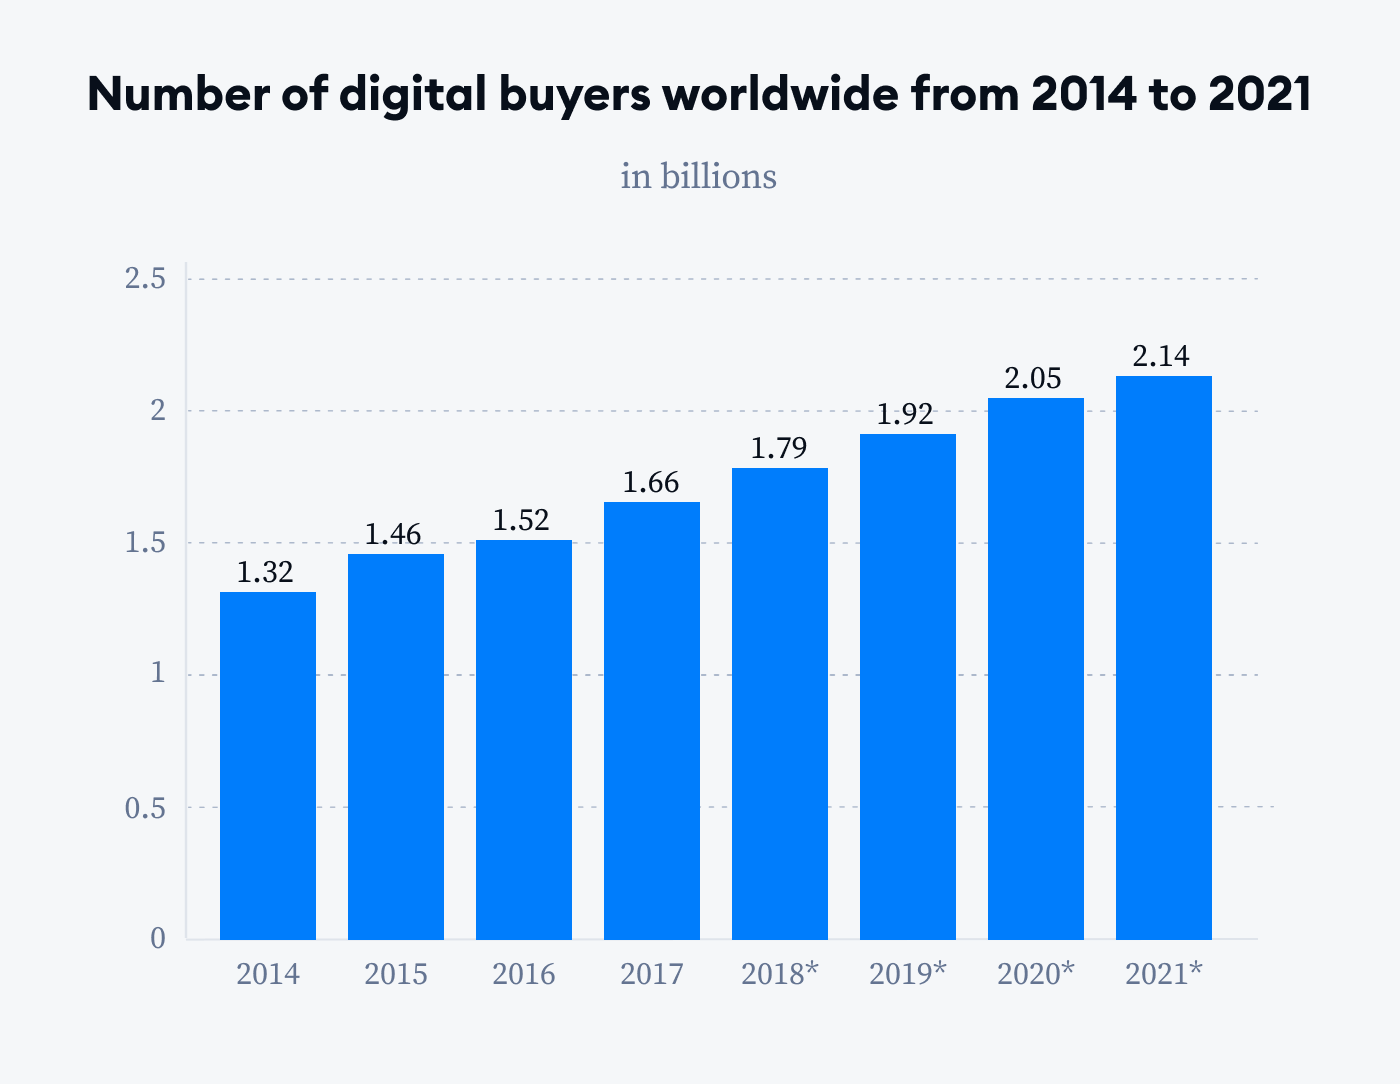
In 2021, the global number of digital buyers was 2.14 billion people and is projected to only continue increasing. By October 2022, the world population will have reached over 7.9 billion people which means that at least 27% of the entire world will shop online by then.
Retail eCommerce sales in the US for Q2 of 2022 amounted to $257 billion, which is a 2.7% surge from the last quarter. Moreover, there are more than 230 million digital shoppers in the US as of this year. Also, according to Digital in Round’s study, 11% of all retail sales originate from online eCommerce stores. This is a clear indicator that people still prefer physical shopping experiences over digital ones although external forces such as pandemics tend to change that trend momentarily.
A similar trend is also observable in Europe, the region’s eCommerce market revenue has been expanding by 13.86% on a yearly basis. By 2025, it is predicted that there will be around 564 million eCommerce users in Europe.
China has the largest eCommerce market share
No doubt about it, China is the top eCommerce market in the world. This honor goes to Alibaba’s subsidiary eCommerce platforms: Taobao, Alibaba.com, and Tmall. But that’s not all. with an annual growth rate of 21%, China is also one of the fastest-growing eCommerce markets.
Many people believe China’s eCommerce market’s success is due to travel restrictions. However, this isn’t the only reason. In fact, 842 million people shopped online in China in 2021.
A report found that the majority of China’s cross-border online shoppers plan to spend more money online in 2022. This makes a significant contribution to global retail eCommerce sales.
Given that China’s population represents 18.47% of the globe, don’t write it off as unimportant in terms of buying power. For example, According to Statista, Alibaba, the country’s leading online retailer, had approximately 903 million active consumers in early 2022.
Numerous other eCommerce titans in China, including JD.com, TMall, and Taobao, play a significant role in the country’s online sales volume. A majority of these businesses also have resellers who sell their products worldwide.
China and the United States hold the top two positions for retail eCommerce sales. Closely following in third is the United Kingdom, with a 4.8% share of total global retail eCommerce sales. The UK is closely followed by Japan (3%) and South Korea (2.5%).
eCommerce Platform Statistics
Deciding which eCommerce platform to choose for your online business can be tough. With options like Magento, Shopify, or WooCommerce, it’s hard to know where to start. To help you make a more informed decision about which route is best for you and your business goals, let’s take a look at some statistics regarding these popular platforms.
WooCommerce Has over 5 Million Stores
If you’re looking to create an online store, WooCommerce is one of the most popular eCommerce platforms. By pairing it with WordPress, you can craft a highly effective store that’s more likely to drive sales. Additionally, this eCommerce platform is a great solution if you’re looking for an SEO-friendly platform that is also highly customizable and scalable. You’ll have more control over your design and won’t mind getting your hands dirty. If your primary marketing strategy is driving traffic through content for search engines, this platform is perfect for you.
WooCommerce is a very popular eCommerce solution and, according to the WordPress plugin repository, it has been downloaded more than 5 million times. However, we think that this number may not be accurate. The precise number was removed in April 2017 and the highest figure listed is for active installs.
After an update is released for the WooCommerce plugin, there are around 400,000 automatic downloads. This provides us with some insight into how many stores are actively managed. But all we know is that the total is most likely greater than that number.
In September 2022, Builtwith reports that a total of 6,607,128 websites use WooCommerce. That number comprises the world’s top million websites. While that might seem like a small percentage, it is quite significant in terms of internet traffic and reaches.
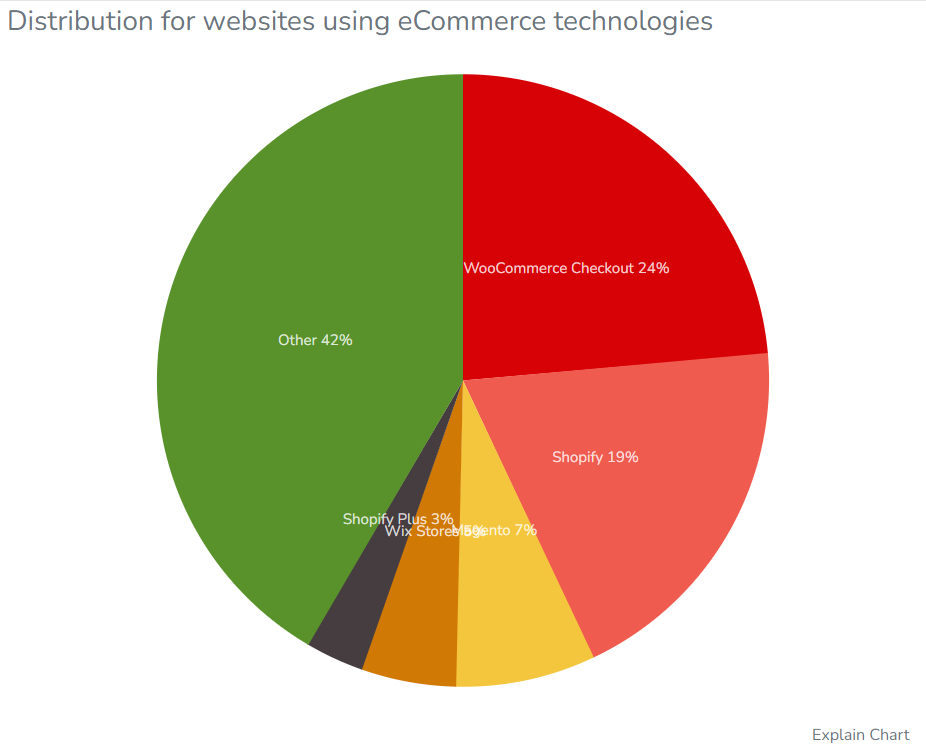
WooCommerce is currently the most popular choice for eCommerce sites, leading both Magento and Shopify in market share. The data from the Distribution of websites using the eCommerce technologies chart below shows that Woocommerce has 24% of the top 1 million site’s market share in 2022.
It’s great that WordPress and WooCommerce are the most popular among smaller sites. This is because bigger-budgeted enterprises are more likely to have custom or enterprise solutions. Furthermore, many businesses want to use Woo’s great SEO features to improve their ranking on search engines and generate more traffic and sales. A lot of people use WordPress for blogging and creating online content, so when they want to start an online business, all they need to do is integrate WooCommerce into their existing WordPress website. It’s really convenient for those who are already familiar with this platform.
Shopify Is The Second Most Popular eCommerce Platform
If you want to construct an eCommerce store, you have to choose an eCommerce platform that will manage payments and other features of your website. Shopify is the most common option available. As we mentioned, WooCommerce is the most popular eCommerce platform in the world right now but it can’t be guaranteed in the near future. If you’re just starting out, it will be trickier to launch your online store with WooCommerce rather than Shopify. With WooCommerce, you need a hosted website as well as WordPress installed. You’ll also need some coding experience or knowledge to set up and configure your store properly. In contrast, Shopify is much simpler and can be used by beginners without any prior coding knowledge or experience.
Additionally, the number of Shopify users has been gradually catching up to WooCommerce in recent years. According to Builtwith, there are 4,147,766 live websites currently being powered by Shopify (The number is counted til the day this article is written).
Shopify store numbers have increased by over 200% since 2020, with 201.53% growth between March 2020 and January 2022 according to genus.ai. This is because more than 2.5 million new Shopify stores were set up in the last two years, during the Covid pandemic saw a huge number of traditional offline retailers move their business online via Shopify.
Shopify consistently ranks high as an eCommerce platforms provider and boasts a 19% share of the top one million sites (these sites are responsible for a disproportional amount of eCommerce traffic and trade). And when Shopify Plus sites are included in the calculation, that percentage rises to 22%. WooCommerce is Shopify’s main rival and holds the top spot overall with 24% ownership of this profitable market (Source: Buildwith). Shopify is known for its ability to build and optimize eCommerce sites, as well as manage the day-to-day tasks that come with running a business. No wonder it’s the top choice for many businesses.
Shopify is a platform utilized by merchants all over the world, in over 175 countries. As we mentioned, there are an estimated 4 million Shopify stores currently online, with 2.7 million of those being based in the US. This means that 65% of all Shopify stores are in America. Furthermore, Shopify’s US store generated 10% of American eCommerce sales this year (2021), according to The Motley Fool source.
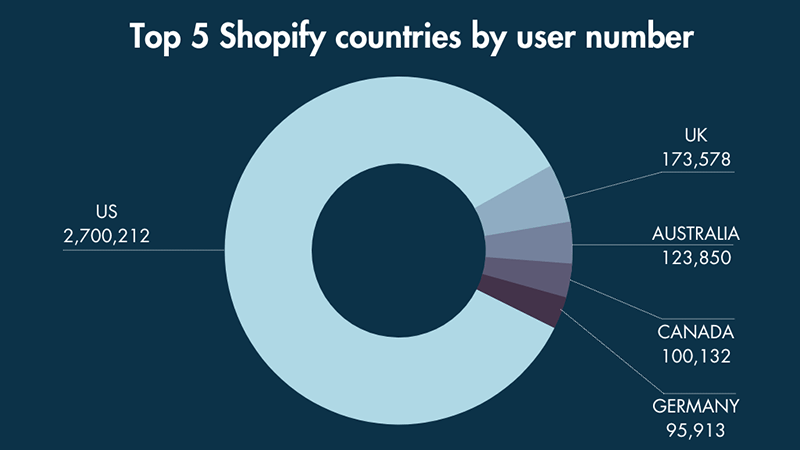
Shopify’s second-largest market, as you can see from Builtwith’s chart above, is the United Kingdom. 173,578 Shopify websites are operating in the UK’s eCommerce market. Like Shopify’s top two markets, its third and fourth most popular countries are both English-speaking nations: Australia takes third place with 123,850 Shopify stores while Shopify’s home country of Canada comes in fourth place with 100,132 stores.
If you want to implement your online store on the Shopify platform, don’t hesitate to discover our seasoned Shopify web development services. You can freely check and assess our ability through implemented projects with multiple huge brand names.
Magento Usage Statistics 2022
Magento is one of the most popular eCommerce platforms available and its success is attributed to a high level of usability as well as customization options. Additionally, Magento has an army of innovators (over 300,000 trained developers worldwide) that have created a robust resource of extensions that add various functions to online stores, helping them grow year after year.
As of October 2022, approximately 163,590 active eCommerce sites online are powered by Magento 1, and almost 100,000 are powered by Magento 2, which accounts for close to 0.9% of all online stores worldwide. This is one noteworthy statistic that confirms how big of a role Magento plays commercially in the industry today against its competitors.
Magento is the third most popular choice for eCommerce sites and lags behind WooCommerce and Shopify in market share. The Distribution of websites using the eCommerce technologies chart above shows that Magento has 7% of the top 1 million site’s market share as of 2022.
In the United States, there are 57,624 sites on Magento 1 and 34,863 sites on Magento 2, making it the country with the most Magento-powered websites, as gathered from data by Builtwith. The second most amounts of Magento website users come from the United Kingdom, where 12,247 websites are active there on Magento 1 and 8,339 on Magento 2.
With Magento, you can easily build and customize your online sales platform to scale your business. With its intuitive interface and robust features, the system is perfect for businesses of all sizes who are looking to take their online presence to the next level.
Other eCommerce Platforms Statistics
Although Shopify, WooCommerce, and Magento are commonly known throughout the eCommerce industry, they’re not the only extremely popular options. Some other well-liked platforms include Wix, Salesforce Commerce Cloud, BigCommerce, and Squarespace.
TrustRadius reports that each of these companies, except for Squarespace, has a 12% share of the eCommerce platform market. Each platform offers its advantages and disadvantages, so it’s best to research all options before deciding which one suits your business needs.
Squarespace is initially known as a website-building tool for beginners. However, it is quickly becoming a top player in the eCommerce software market. It’s estimated that 9% of businesses use this platform because it is user-friendly and provides unique eCommerce features such as wonderful figurable themes.
eCommerce Consumer Statistics
There are many important eCommerce statistics that you need to know about online shopping in order to keep your customers satisfied and improve conversions. By understanding your consumers, what they need, and why they need it, you’ll be able to influence their purchasing decisions more easily. You’ll also find it easier to turn new buyers into loyal customers. Below are some essential stats that you need to capture to take insights from your customers.
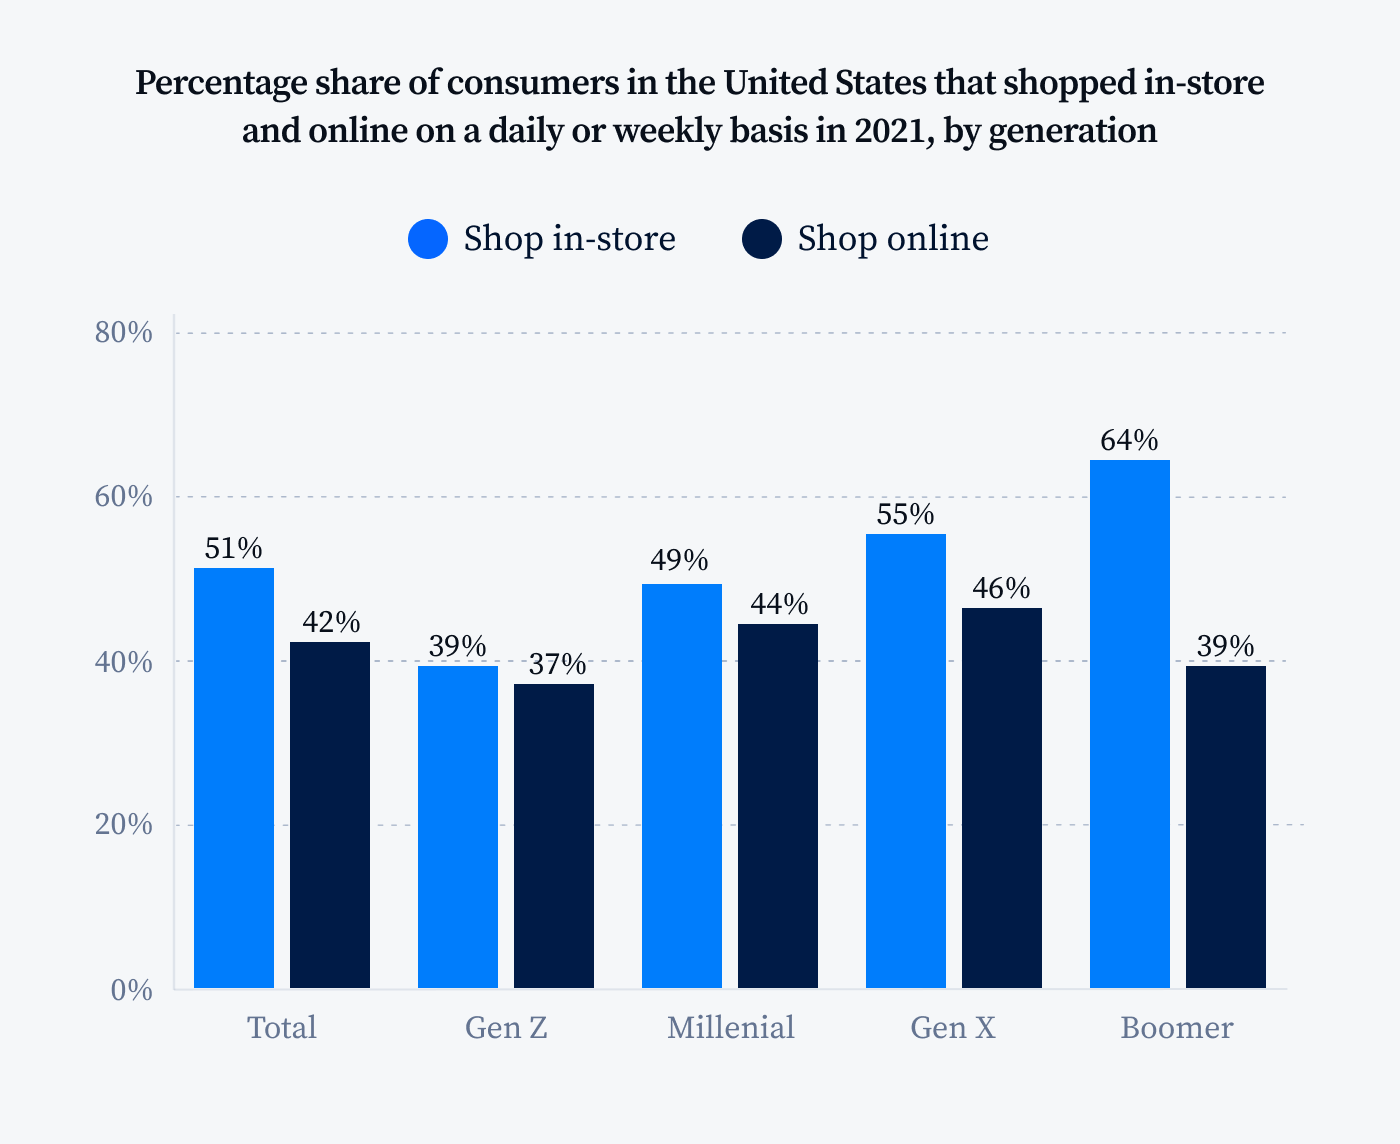
Online Shopping and In-store Shopping
Online shopping has become widely popular only within the last few years, with more consumers choosing to shop online than those who stick to physical stores. The goal of eCommerce is not to immediately phase out brick-and-mortar stores. In fact, some retailers are starting to move towards a model where you can try products in the store and then have them shipped to you.
Some products are more appropriate to buy in person, while some are better buys through a website or app, it all makes perfect sense. Take for example buying a house on Amazon, it sounds not the best idea. That’s why most customers take advantage of both methods. Here in the US, the number of customers who don’t make any internet purchases decreased to only 30%. But those that do shop online still visit brick-and-mortar stores too. Digital buyers frequently shop in both places.
eCommerce sales are constantly increasing and make up a large share of retail. In 2017, online sales accounted for 1/10 of all worldwide sales. By 2025, they are expected to reach almost 25% of total retail sales.
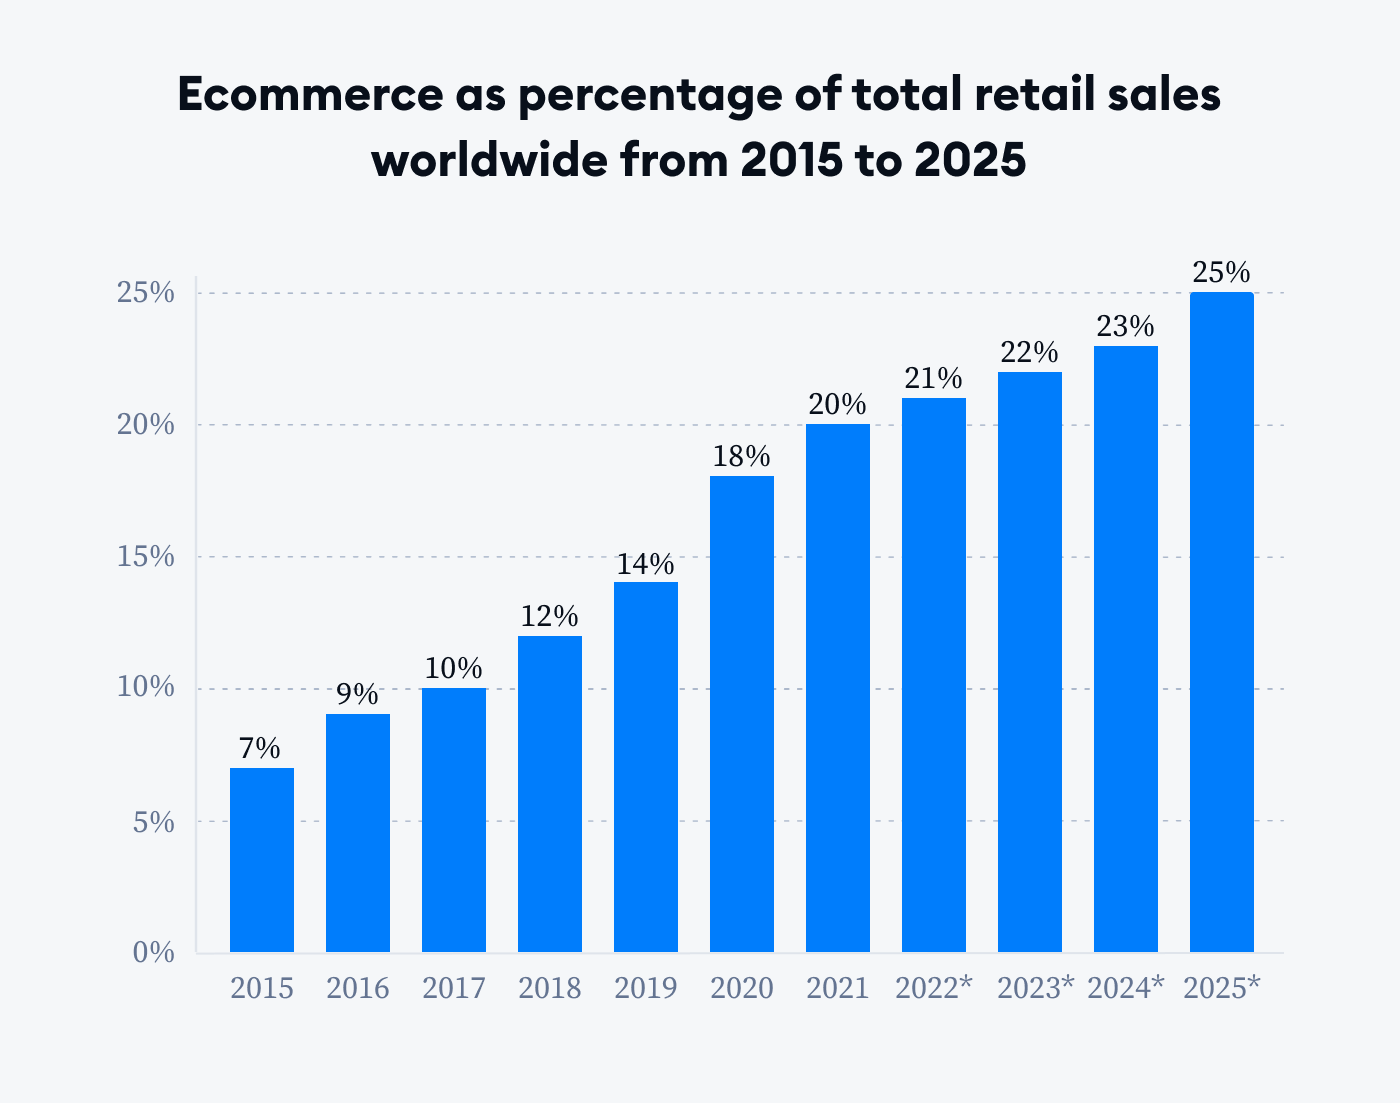
eCommerce currently accounts for about 21% of all retail sales, and this number is only increasing. Though brick-and-mortar stores are declining in the United States, total sales volumes at physical stores are still growing annually by 4%. In contrast, eCommerce sales have an annual growth rate of 13%. (Source: Tidio)
In 2021, the number of physical stores in America dropped from 450,000+ locations to 350,000. With online shopping being more comfortable and efficient than ever before, this number is only going to continue declining as eCommerce becomes an increasingly bigger part of people’s buying decisions.
People from all around the world are now turning to eCommerce stores to purchase their items, and this change is being primarily led by young people. With how simple it is to use a smartphone to access these shopping apps, it’s no wonder that sales made via mobile devices are on the rise.
The Number of Online Shoppers
The digital world is ever-expanding, and with it comes a corresponding increase in the number of people shopping online. In 2021, 2.14 billion people around the world are now doing it. If we look at the current population of 8 billion people, that means 27% of them are digital buyers. And by the end of 2022, it’s estimated that there will be even more than 2.3 billion consumers making purchases from online retailers.
According to Tidio, on average, global shoppers spent $1,060 on online purchases in 2015. By 2021, this number had more than doubled to $2,310 annually. In some countries, the numbers are even higher; for example, digital shoppers in the United Kingdom spend over $4,200/year on average.
The number of shoppers is constantly increasing and so is the frequency of online shopping. The primary reason driving such a quick rise in smartphone penetration among Chinese consumers are 1 billion active smart devices and mobile phones currently being used on a daily basis. Furthermore, eCommerce industries in countries, like the United States, continue to grow steadily.
Online Shoppers’ Demographics
Tidio’s research reports that when it comes to the eCommerce sector, Gen X online buyers are still the most relevant customer group. They make regular online purchases and have an average yearly expenditure of almost $70,000, higher than any other generation. While their total cumulative spending power is lower than Baby Boomers’, they make up for it by shopping online more frequently.
38% of people are afraid of overloading their credit cards, so Gen Z and Millennials instead choose to use debit cards when shopping. On the other hand, older generations prefer options like credit cards or cash-on-delivery. Social media plays a significant role in 35% of Millennial’s purchase decisions. Out of all channels, social marketing is most effective for this demographic group.
This research has also found that around 45% of Gen Z customers cross-reference prices in multiple online outlets to find the best deal. In contrast, Gen X and Baby Boomers are less likely to browse multiple online stores than younger generations. This difference can be linked to the fact that older generations have more disposable income and can afford to make purchases without hunting for bargains.
In addition, there is a clear correlation between gender and buyer behavior, which is most evident when looking at the categories of products that are most often purchased online. Women are more likely to buy fashion and clothing items (71% vs 49% for men), while men are more interested in new technology-related products (49% vs 31%).
Female shoppers, on average, buy online 7 times per year compared to men who only make online purchases 5 times a year. Men tend to spend more when they do purchase something online, $220 per transaction as opposed to $151 for women. Women also make purchase decisions 7% faster than men. Because of this pattern, many retailers target women in their social media marketing campaigns that aim to stimulate impulsive buying decisions.
Average Online Shopping Cart Abandonment Rate
According to the data collected by Baymark Institute, 69.99% of shoppers abandon their carts on average. Interestingly, mobile users have an even higher rate of abandonment. This is a clear sign that you need to optimize your eCommerce site for mobile users today.
Many people assume that all cart abandonments are bad for business, but this isn’t always the case. In fact, a large portion of abandonment is simply due to users exploring and window shopping. While it’s not ideal, these types of abandonments are mostly unavoidable. So don’t worry too much if you see a dip in sales occasionally. It’s likely just users browsing gift options or price comparing.
According to Baymark Institute, in the last 3 months alone, 58.6% of online shoppers in the US have abandoned a cart due to aimless browsing with no intention of making a purchase, and most abandon before they even reach the checkout flow. To better understand the phenomenon overall, Baymark provides 3 additional main reasons: unexpected extra costs; account creation requirements; and slow delivery processes.
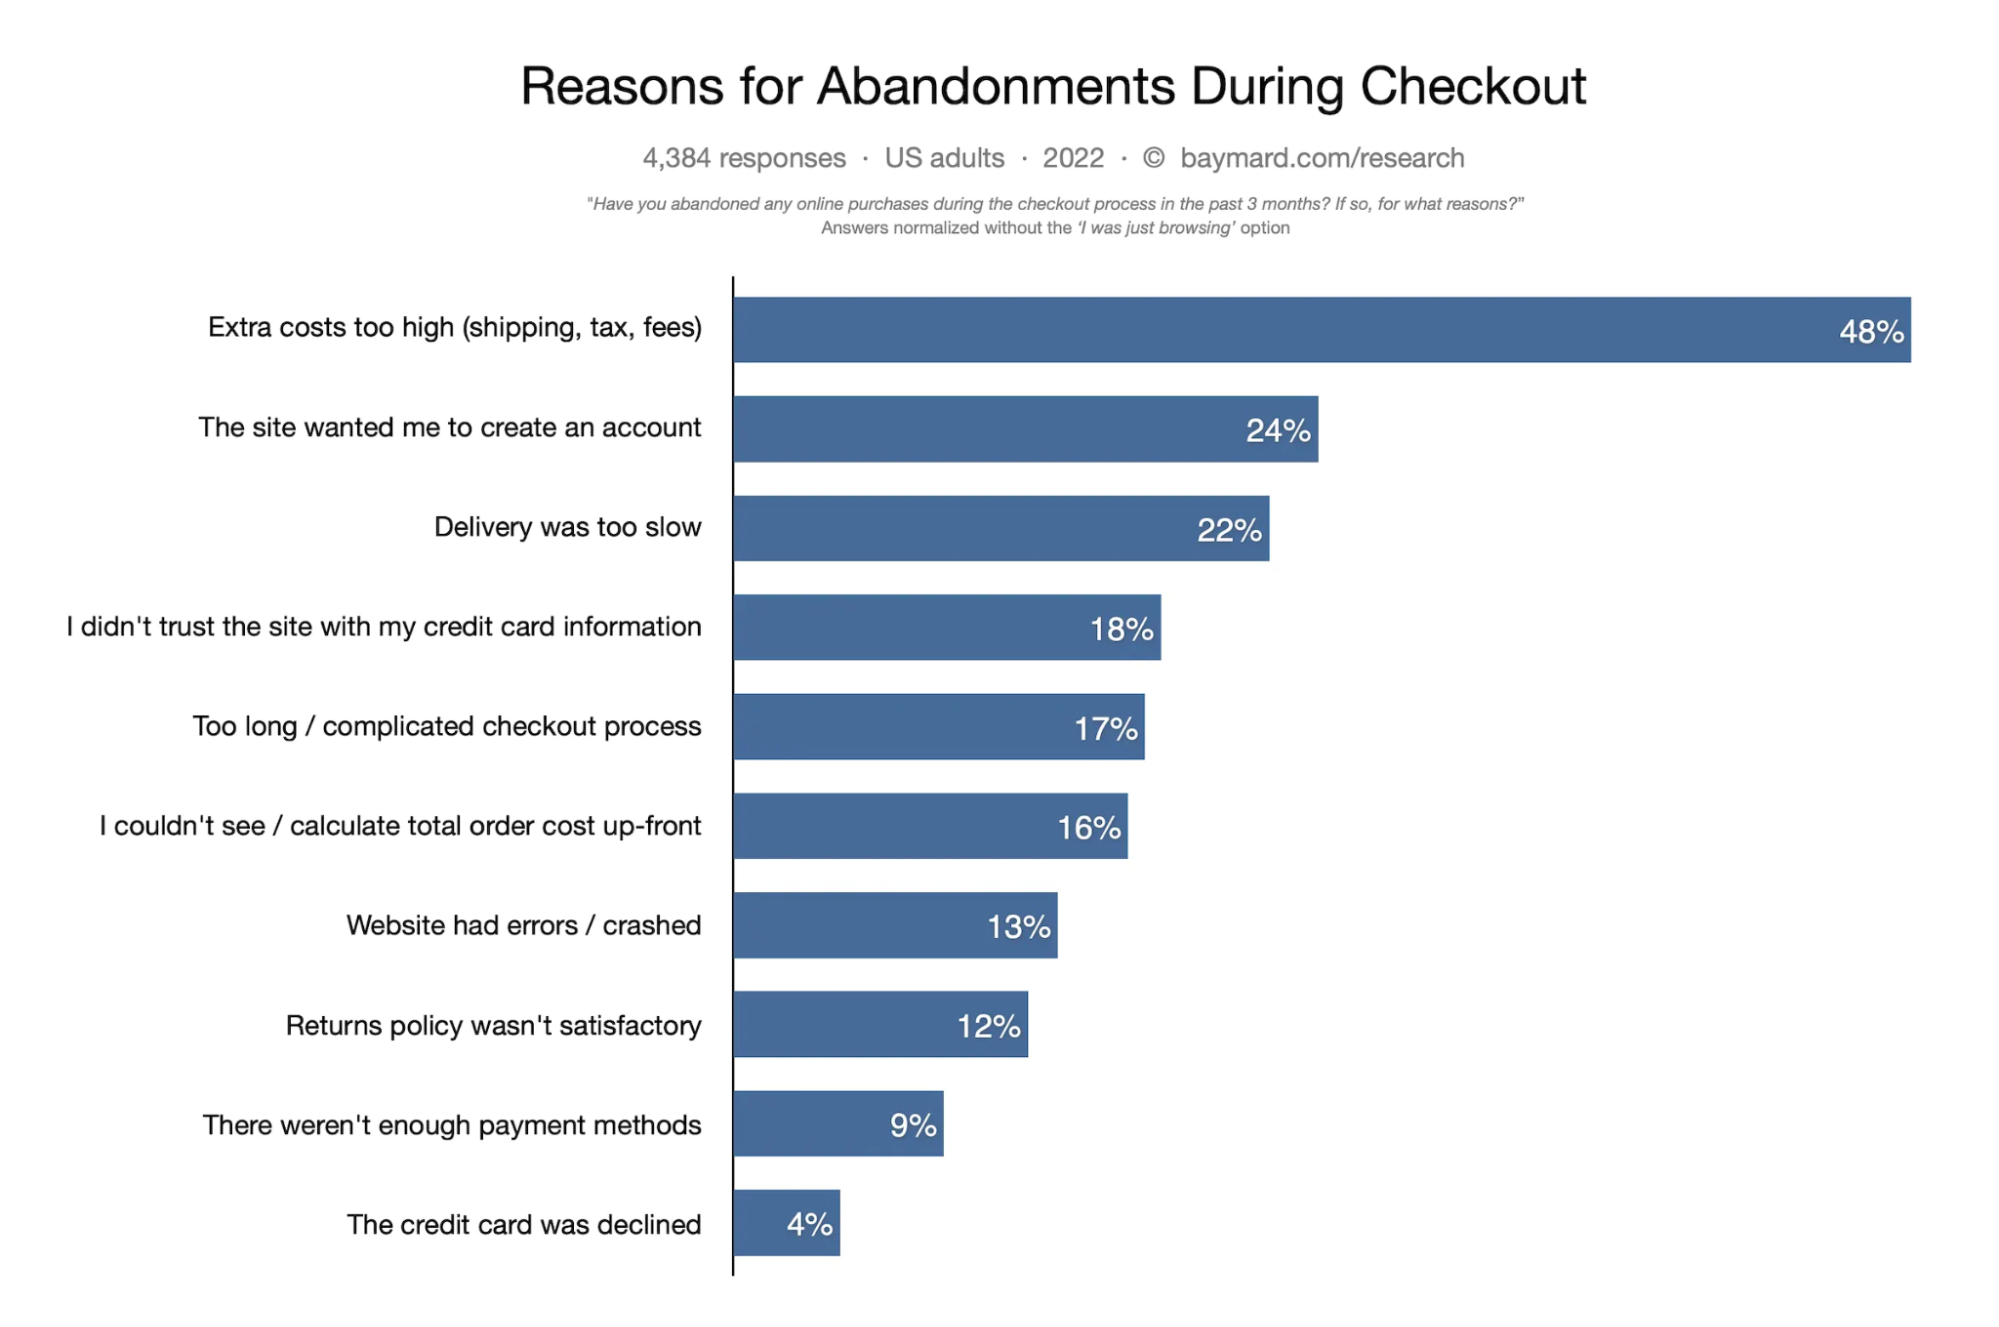
Many of the issues that “just browsing” shoppers have can be resolved with design changes. Free shipping is particularly effective in reducing online shopping cart abandonment on mobile and desktop devices. And if your eCommerce site has a registration system, let users make purchases without registering.
Not only that, but 17% of Baymard’s respondents have stated they’ve abandoned their shopping carts due to convoluted checkout processes. With Europe and US eCommerce sales equating to about $738 billion annually, it’s estimated that optimized checkouts could save up to $260 billion worth of lost orders yearly.
Therefore, optimizing your checkout process and page design is an excellent way to reduce cart abandonment. Try implementing some of the following best practices: mandatory signups, support of multiple digital payment methods, exit-intent popups…
Online Shoppers Consult Reviews Online Before Making a Purchase
According to a Trustpilot study from 2020, 89% of consumers globally take the time to read reviews before making a product purchase. Not only does this show that reviews are an essential part of shoppers’ decision-making process, but it also suggests that buyers have a high level of faith and trust in their peers’ opinions.
As you are probably aware, potential customers take authenticity and transparency into consideration when reading reviews. In fact, reviews with perfect scores may actually do more harm than good. Additionally, eCommerce owners should avoid manipulating their reviews in any way, this includes censoring negative reviews. According to online review statistics from Trustpilot (2020), as many as 62% of consumers say they will not support brands that engage in review censorship. This is a practice that could have harmful consequences for sales figures.
Although online reviews aren’t as powerful yet as personal recommendations from family and friends, they still hold a lot of sway over consumers. According to BrightLocal’s latest online review statistics, almost four in five (79%) consumers say they trust the reviews they read online just as much as personal recommendations (BrightLocal, 2020).
Did you know that 97% of online shoppers who read customer reviews also look for responses from the company? By replying to both positive and negative feedback, you create a stronger brand presence. Strive to answer any unhappy customers within one week so their displeasure doesn’t have time to fester.
And if you want your business to succeed, it is essential that you are visible on Google My Business. With 59% of online shoppers using the site to find reviews, not being listed means potential customers could simply move on to your competitor.
The statistics discussed above make it evidently clear how important reviews are for a business. If you want to get the most out of reviews, don’t just depend on third-party platforms; put them prominently on your website and product pages as well. Doing so will help increase sales noticeably.
More Than a Half of Online Shoppers Consider Sustainable Packaging
Sustainability is becoming increasingly important to consumers, with 54% considering it when making a purchase, according to Trivium Packaging. With the pandemic driving record numbers of deliveries in 2020 and 2021, there are now 6.3 billion tons of plastic waste globally.
With the world producing more and more inorganic waste every day, eco-consciousness is growing among consumers. In fact, 64% of American shoppers are now willing to spend extra on sustainable items.
One of the simplest ways to make your business more sustainable is by ditching paper or harmful packaging materials in favor of biodegradable options. In-house product production gives you greater control over what ingredients are used. By choosing eco-friendly ingredients, you can make your brand more appealing to sustainability-focused customers.
Mobile Commerce Statistics
There are many eCommerce merchants who don’t realize the potential that mobile commerce offers. With more people owning mobile devices, there is a larger opportunity to turn website visits into purchases and increase brand awareness. The statistics below will show just how influential mobile commerce can be in purchasing decisions.
Retail mCommerce sales hit $359.32 billion in 2021
The retail industry is booming, with mCommerce sales expected to more than double by 2025. According to Intelligent Insider, retail mCommerce sales hit $359.32 billion in 2021, an increase of 15.2% over 2020. By 2025, retail mCommerce sales should reach $728.28 billion and account for 44.2% of total US eCommerce sales
The global mobile commerce market is growing because more and more people are using their phones to go online. In fact, today over 67.2% of all online transactions happen on a mobile device.
Insider Intelligence has predicted that in 2024, the volume of mCommerce will hit $620.97 billion and account for 42.9% of eCommerce sales. The two driving devices behind this revolution are smartphones and tablets.
Even though small screens have caused historically poor conversion rates due to customer frustration, smartphones are now the primary driving force behind mCommerce growth. In the US alone, volume is expected to increase from $128.4 billion in 2019 to a whopping $553.28 billion by 2024!
Although tablets don’t compare to the number of sales from smartphone mCommerce, they are still playing a significant role in its success. In 2022, it is estimated that $64.06 billion will be spent on tablets for mCommerce.
Mobile still dominates online traffic
ContentSquare’s data for 2021 shows that mobile devices are continuing to dominate online traffic, with 58% of all visits coming from smartphones. Last year, they reported that 64% of all traffic was from mobile.
Nevertheless, the average conversion rate on desktop devices is much higher than that of mobile devices, this difference indicates that many consumers use their mobile devices to window-shop before making a purchase on their desktop.
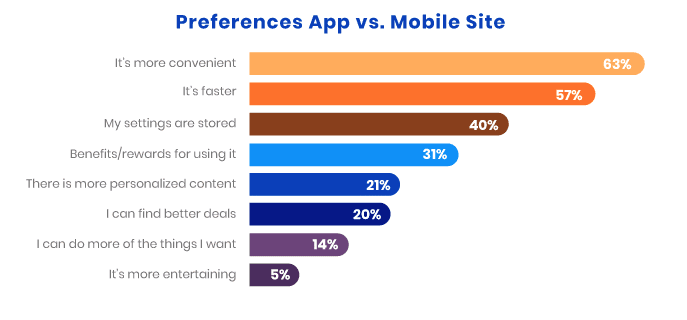
According to Buildfire’s statistics, 63% of consumers claim they find mobile apps more convenient than mobile websites. The main reasons for this preference are speed (cited by 57% of respondents) and the storing of settings on apps (liked by 40%).
According to these statistics, people spend, on average 3 hours and 40 minutes using their mobile devices each day. Out of that time, only 10% is spent on a web browser. In the United States, it’s estimated that Americans spend one-third of their waking hours looking at their phones, much more than other averages.
In short, if you have an online store and are only relying on a mobile site to make sales, you’re missing out big time. Developing a mobile app for your customers provides them with a better shopping experience and will result in more eCommerce sales.
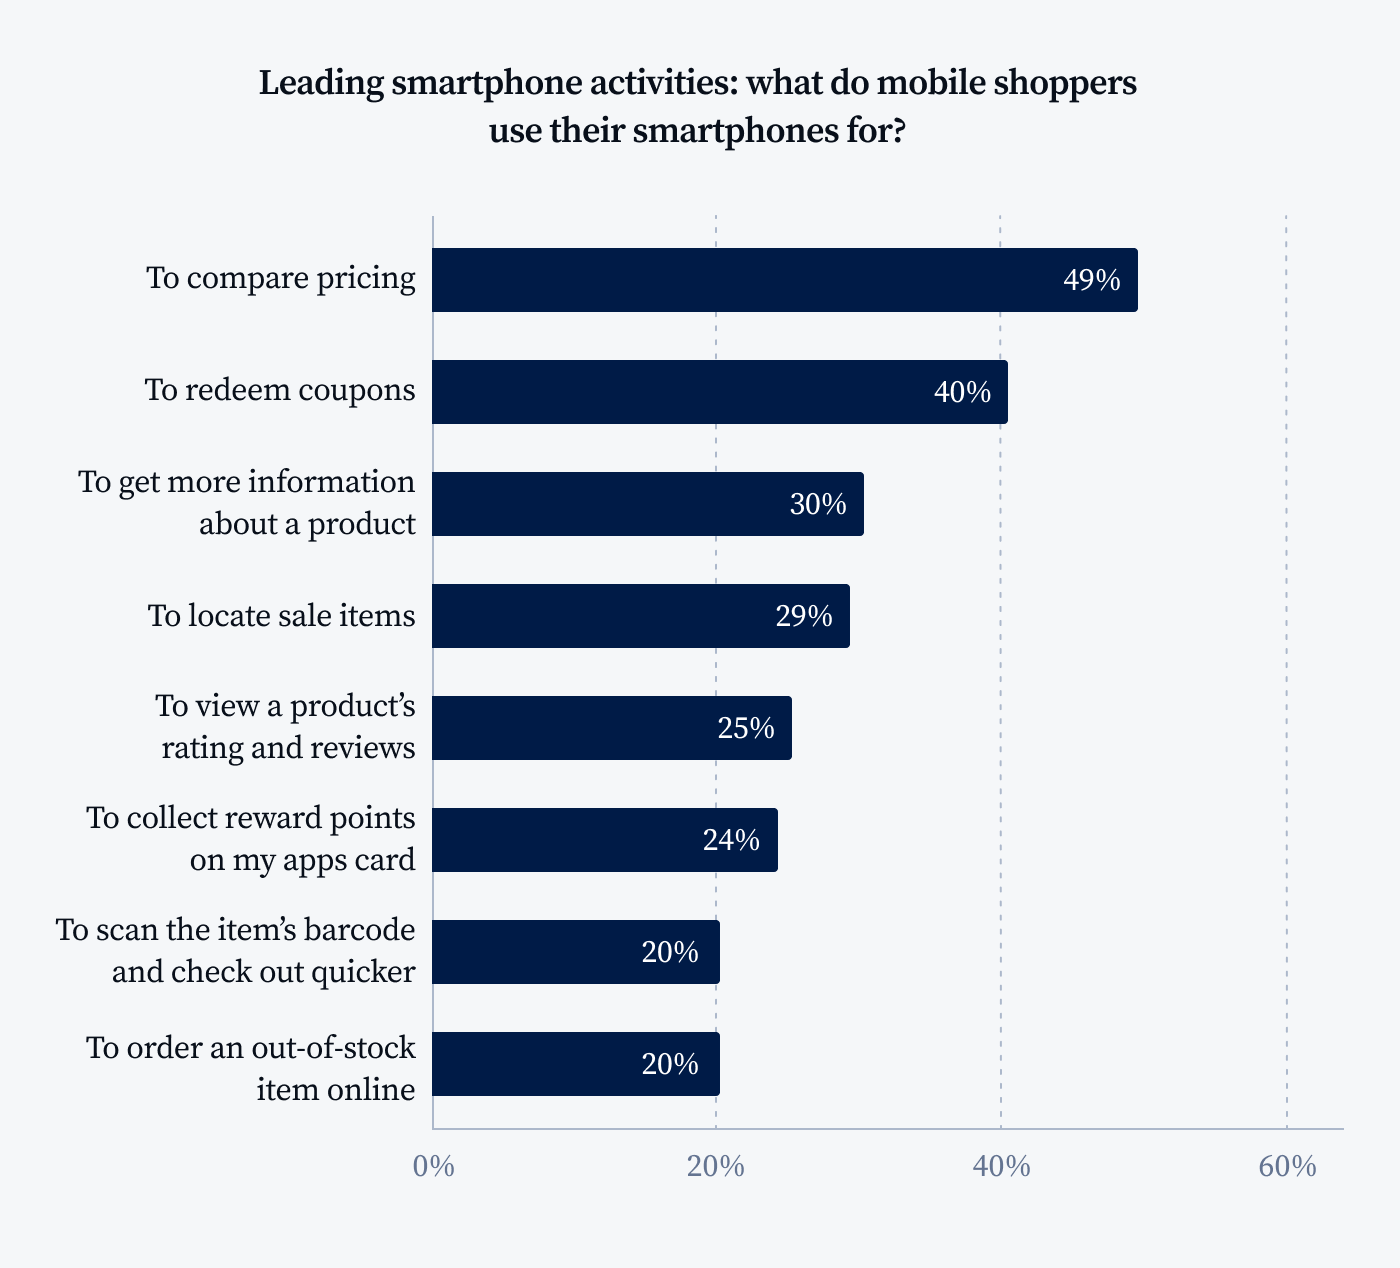
Under half of all mobile users use their smartphones to compare product or service prices
Tidio’s research has found that mobile shoppers primarily use their devices to compare the pricing of products and services (49%), redeem coupons they have been offered (40%), and learn more about a product they are interested in (30%).
In other words, many times the first time a potential customer visits your eCommerce site is through their smartphone. If the website doesn’t load quickly or if photos of products cover up descriptions, it creates a bad first impression of your business. We’re willing to bet that this would be the first and last step in their journey as one of your customers.
Voice Shopping is estimated to reach $40 Billion in the US by 2022
According to Invesp, by 2020, 50% of searches will be voice searches, and Voice Shopping is expected to reach $40 Billion in the US by 2022. More than 30% of internet users have used a voice assistant for product information or purchasing products.
The popularity of mobile devices has allowed the voice commerce market to grow globally. With a voice assistant, users can control mobile gadgets without needing to type, making it more accessible for everyone.
By 2022, 62% of US adults will be using voice assistants. Moreover, 80% of consumers who have purchased items with voice assistants report satisfaction with their experience.
You can optimize your store for voice search to customize the shopping experience for each visitor. Consider local SEO and using long-tail keywords so that people searching by voice will be able to easily find your store.
QR Code Payment users to reach 2.2 billion globally by 2025
Juniper Research recently found that the number of people using QR codes to make payments will exceed 2.2 billion in 2025, up from 1.5 billion in 2020; equating to 29% of all mobile phone users across the world in 2025.
The study forecasted a significant 240% growth in QR code payment users in the US from 2020 to 2025. It credited this largely to PayPal’s recent adoption of QR payments and partnership with CVS, which has tapped into Americans’ growing need for cashless options during the pandemic (11% more people have been using QR codes since the pandemic began).
The authors also discovered that QR codes are perfect for retailers who want to take advantage of valuable purchase data. Additionally, because QR code solutions are low-cost, it is projected that global growth will reach over $2.7 trillion in 2025.
You can use QR codes in a number of ways to bring people to your website or store. One way is by adding them to promotional materials for your online shop. A lot of people will scan the code out of curiosity, and this makes it more likely that they’ll visit your site. If you have a physical store, another great way to increase traffic is by allowing QR code payments, this creates a better shopping experience overall and gives customers more payment options, which can influence whether or not they make a purchase from you.
Top mCommerce apps
Good in-app shopping experiences result in customers who are more likely to return, and consequently, make purchases. Some stores are already aware of this fact, but which ones? Also, what mCommerce apps do people use the most?
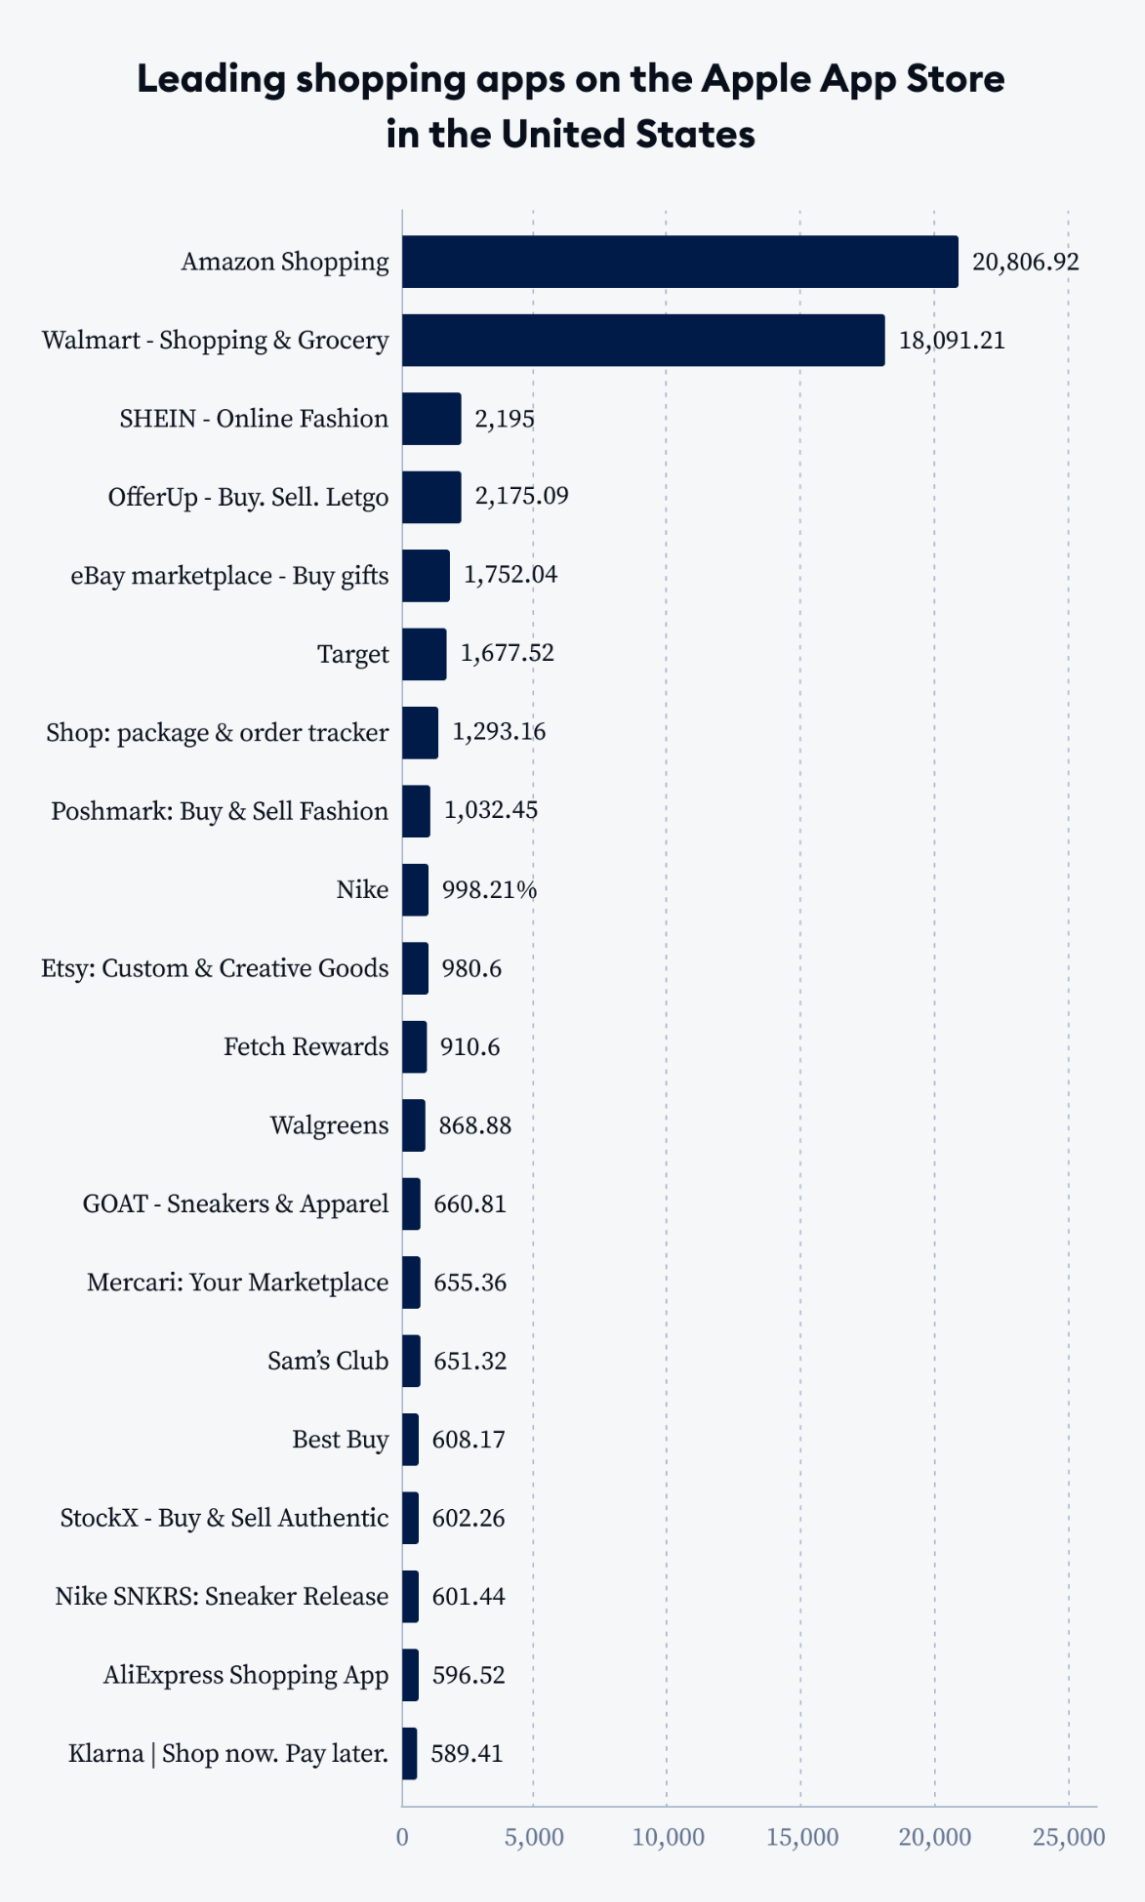
Based on Tidio’s chart, you can see that Amazon Shopping is the most popular mobile commerce platform available on iOS. This is because it has 20.8 million daily active users (DAUs). The second most popular option is Walmart’s app with 18 million DAUs while SHEIN falls in third place close to 2.2 million iPhone owners using their platform daily.
It’s no wonder Amazon is so successful when 61% of its customers say it provides a more streamlined checkout than its competitors. The other two advantages are that it’s easier to search for desired products (65%) and there is more information available about the features and quality of the products (57%).
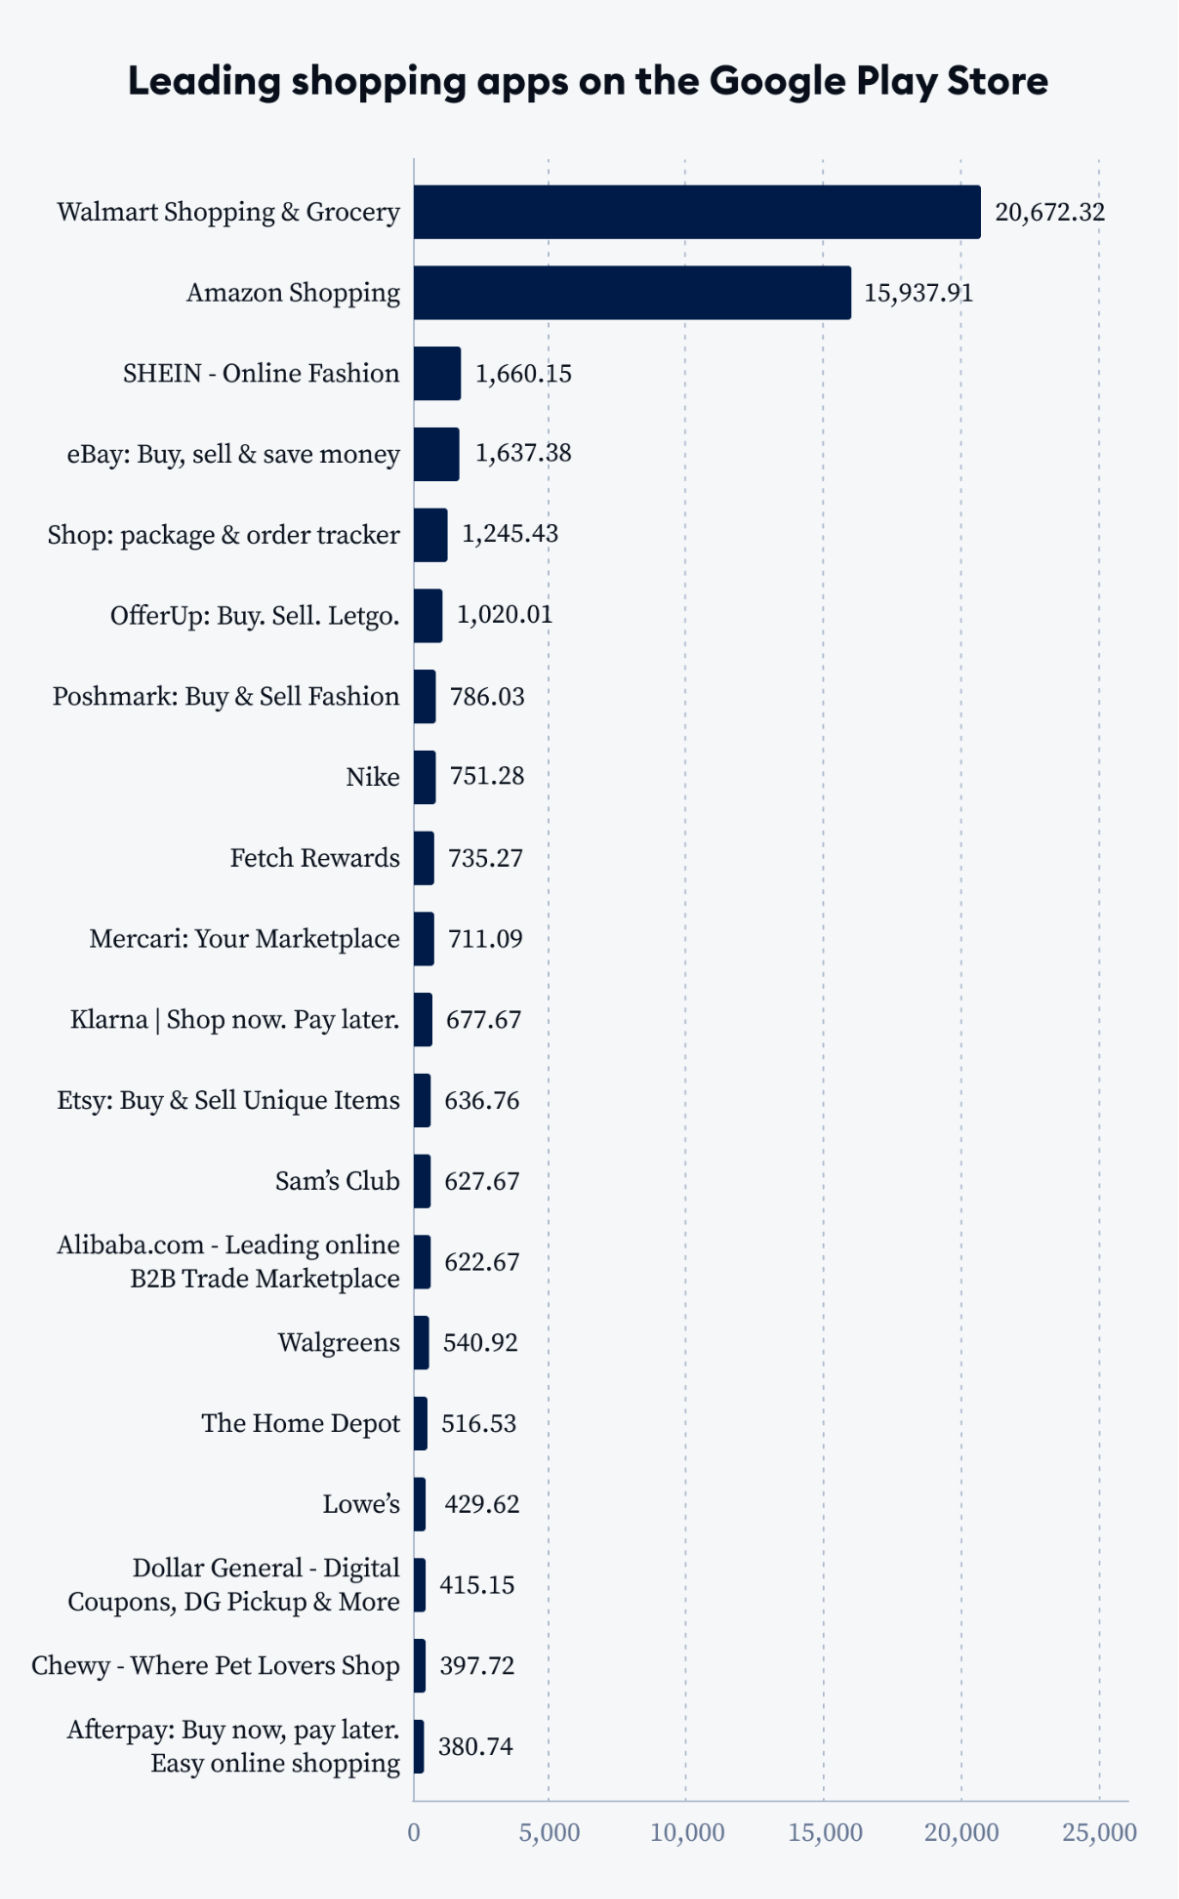
Unlike the top mCommerce apps on IOS, Walmart Shopping & Grocery is the most used mobile commerce app for Android with 20.7 million daily active users. Amazon’s app also does well in the mCommerce market among US consumers using Android, claiming second place (nearly 16 million DAUs). SHEIN stands as the third most popular option with 1.6 million daily active users.
eCommerce Marketing Statistics
eCommerce marketing has changed a lot over the years. If you want to stay ahead of your competition, it’s crucial that your marketing campaign is on point. Use the following statistics to help you design the best eCommerce marketing campaign possible.
Potential customers want to purchase from online stores that offer live chat support
Live chat plays a significant role in the overall eCommerce experience and user engagement. According to a Kayako report, 79% of eCommerce sellers agree that implementing live chat has improved their sales, revenue, and customer relationships. Additionally, 38% of consumers are more likely to buy from a company if they offer live chat support.
These statistics show that live chat support is important to customers when deciding whether to make repeat purchases from an online company. About 51% of consumers are more likely to buy again from companies that offer live chat support, and 63% of people who spend $250-500 a month online are most loyal to companies with this feature.
However, live chat firms that don’t provide good customer service will quickly see buyers begin to shop elsewhere. According to a study, 24% of consumers claim long wait times are the most frustrating thing about customer service, while 29% find scripted responses impersonal and aggravating. Additionally, 9% say they get irritated when having to repeat themselves during a live chat session.
Many shoppers prefer to chat with a live person while they’re shopping, so it’s important to provide an excellent live chat experience in your store. Invest in a knowledgeable support team that can provide personalized expert assistance and avoids giving scripted responses that make your company’s consumer interactions impersonal. Additionally, optimize the queuing system to reduce wait times.
83% of online customers said belonging to a loyalty program influences their decision to buy again from a brand
According to Yotpo’s surveys, customer loyalty programs are an excellent way not only to increase conversions but also to keep customers coming back. In fact, 83% of online customers said they’re more likely to buy again from a brand if they belong to its loyalty program. Additionally, the majority of global consumers (85%) agreed that they would be more inclined to purchase products from a company whose values mirror their own, a sentiment held by over 90% of Gen Z respondents.
If you improve customer retention by only 5%, your business’s revenue will automatically increase by at least 25%. The reason is that 42% of consumers spend more money on brands they’re loyal to. Because numerous companies are creating loyalty programs nowadays, the competition has become very tough. Though, developing effective loyalty programs takes a lot of work.
It’s important to remember that 79% of customers are no longer interested in collecting points. So if you’re thinking about starting a loyalty program, consider offering immediate rewards instead of points. Premium or paid loyalty programs have become a popular alternative to the traditional type recently. In fact, 81% of traditional loyalty members would be willing to join a premium loyalty program if the included benefits were valuable enough. Some popular premium loyalty rewards include free shipping, immediate discounts, and online deals.
89% of Digital Businesses are investing in personalization
Business personalization is a top priority for many companies. According to Spiceworks, 89% of eCommerce businesses are investing in personalization, including well-known brands like Netflix, Sephora, and Wells Fargo. Meanwhile, 80% of consumers say they’re more likely to buy from a company that provides a tailored experience. And it’s not just customers who are frustrated by impersonal shopping experiences. 71% of them say that how well a company understands their individual needs affects their loyalty.
These are the reasons why personalization is a top priority for 51% of marketers and 79% of businesses in the retail sector are ready to invest in personalization tools. The goal of this activity is to improve customer experience.
In order to create more personalized campaigns and shopping experiences for your customers, you need accurate data. Fortunately, there are tools like Google Analytics that can help you do just that by monitoring various website statistics. This will give you a better understanding of their preferences and habits so that you can make the necessary adjustments.
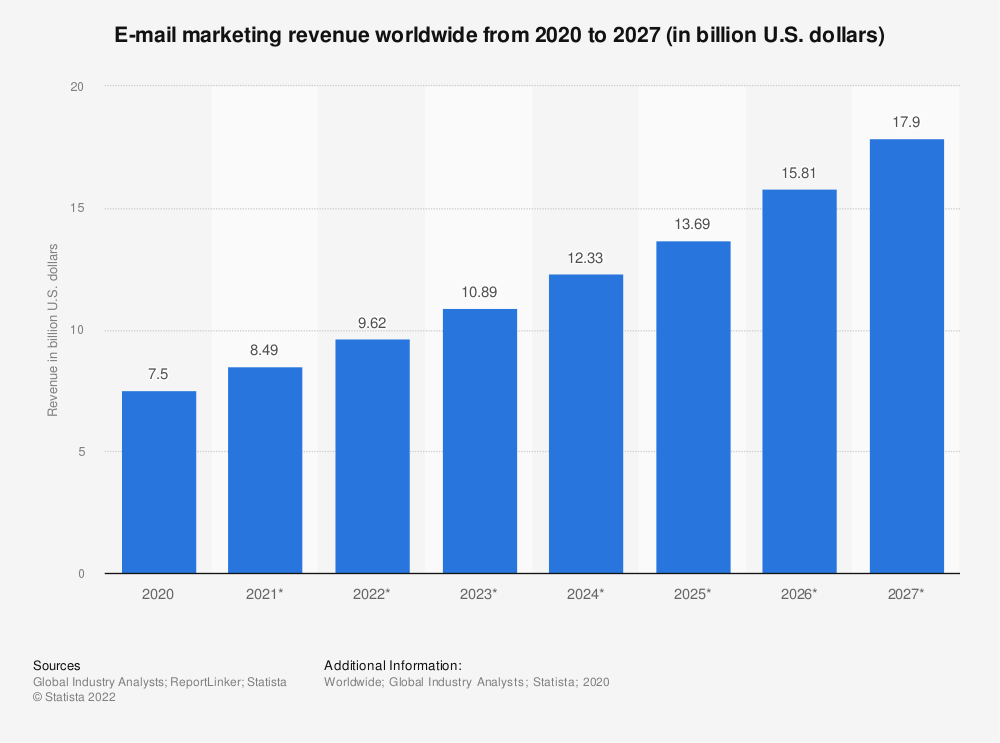
Email is still an effective marketing tool
By 2025, 4.6 billion people will use email, making it one of the most critical digital marketing channels. This number has been increasing rapidly, as in 2022 there were 4.26 billion people using emails (this is more than half of the global population).
Email marketing has a very high return on investment, especially in retail, eCommerce, and consumer goods industries. According to Litmus, for every $1 that marketers spend on email marketing, they receive 36$ back in return. This encourages 60% of consumers to make a purchase from the company. It means that the ROI for properly applying email marketing tools is 3,600% if the content and offers in your emails are already great.
Email personalization is nearly as important as content personalization, with increased unique open rates by 29% and unique click rates by 41%. Statista predicts that the revenue of email marketing will reach almost 11 billion dollars at the end of 2023.
If you’re looking to get into email marketing, the best place to start is by building an email list. You can use platforms that manage your signup forms and emails. According to Hubspot Blog Research, some of the most successful strategies for email campaigns are subscriber segmentation (78%), massage personalization (72%), and email automation campaigns (71%).
Video Marketing plays an important role in businesses’ marketing strategies
The statistics of PopupSmart state that online videos will make up over 82% of all consumer internet traffic by the end of 2022, which is 15 times more than in 2017. Also, 86% of businesses use video as a marketing tool because it is more engaging than text and images. This means you’ll get views and click-throughs when posting on social media if your content contains videos.
The data indicates that the majority of people are more likely to purchase a product or use a service after watching a brand video, rather than reading an article about it. In fact, 84% of respondents said they had been convinced to buy something after watching a brand’s video, while only 18% said they would prefer to read text on products or services.
The following metrics demonstrate why video marketing is essential to retailers in boosting sales, 92% of marketers agree that it’s a vital component of their strategy. Additionally, 94% say that videos have helped customers better understand what they’re offering.
By posting short videos about your products, you don’t have to rely on online ads to attract potential customers or retain existing ones. This type of marketing tool helps businesses increase traffic to their website by 86%, generate 84% more leads and directly contribute to an increase of 78% in sales. Video content is something that 54% of consumers want from the businesses they support, making it an important aspect for any business owner.
eCommerce Social Media Statistics
The number of people using mobile devices and social media platforms is constantly growing, so it’s no surprise that social sites have become one of the best places to market and sell products online. Here are all the facts about social eCommerce.
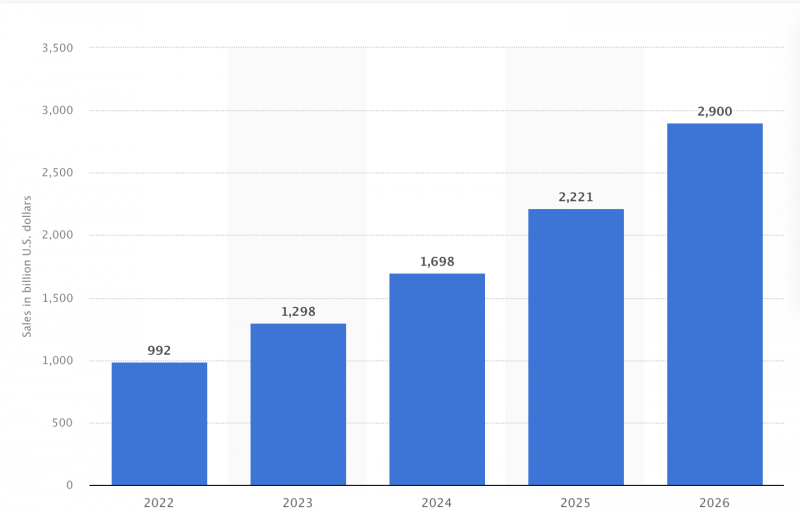
Social commerce sales are expected to reach $992 billion globally by 2022
According to online data shared by Statista, it’s estimated that in 2022 sales via social media platforms across the world will add up to $992 billion. Its popularity is showing no signs of dying down and further predictions anticipate that it will reach nearly $3 trillion by 2026.
Social media usage has increased significantly in the past few years. The average daily time spent on social media is now 2 hours and 27 minutes, according to the Digital 2022 Global Overview Report. To put this into perspective, more than a third of the time that internet users aged 16 to 64 spend online is spent on social media. And it’s not just one platform that people are using; the report shows that each month 7.5 different social media platforms are visited by users.
Also according to this report, nearly 28% of internet users aged 16 to 64 use social media mainly to seek inspiration for activities or purchases. Just over 26% stated that they follow brands on social media in order to see what new products are available. Even if individuals aren’t using it specifically for shopping purposes, it’s still proving an effective channel for marketing. 23% responded that their favorite brands’ content is the main reason they log onto social media sites.
By establishing a presence on these online channels, you can improve your brand awareness and turn visits into social commerce sales. To incentivize online customers to share their favorite products on their accounts, add social media icons to your store. WordPress has many social media plugins that you can install to let visitors share your products and content.
China is continuing to lead the pack when it comes to social commerce. In 2021, approximately 50% of internet users in China have made a purchase through a social network.
To help you have a clear understanding, around 36% of internet users in the US are social buyers, which amounts to approximately 90 million consumers. In the UK, a third of surveyed consumers have shopped via a social network at least once. If eMarketer’s predictions are accurate, in 2021 Chinese social commerce sales will surpass $350 billion, which is 10 times the amount of US sales.
Additionally, this growth is expected to continue steadily into the future. China’s social commerce market is anticipated to grow at a compound annual rate of over 30% between 2020 and 2027. eMarketer predicts that there will be nearly 450 million social buyers in China by 2023. And 37.9% of social buyers across the world are projected to come from China by 2027, but this number could be higher.
According to eMarketer, if you translate this growth into sales, retail social commerce sales in China will exceed $470 billion by 2023. For perspective, in 2020 it was “only” around $240 billion.
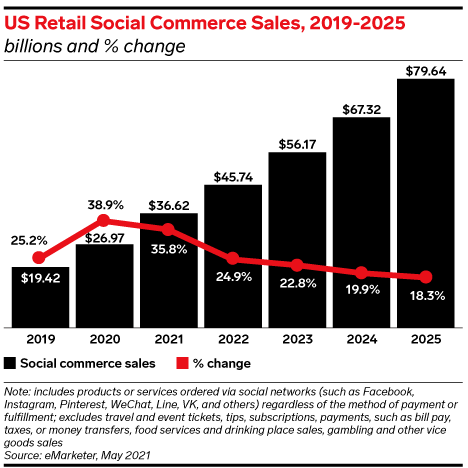
Social commerce is growing in popularity not just in China, but in the United States as well. In fact, it’s estimated that by 2025 there will be nearly 108 million social buyers in America and retail social commerce earnings will amount to approximately $80 billion.
To help you imagine easier, in 2019, eMarketer reported that retail social commerce sales in the USA amounted to less than $20 billion. Just one year later, this number increased by almost 40%. This is likely due to changes in shopping habits brought on by Covid-19.
Although it’s remarkable, we shouldn’t forget that China was already predicted to reach $350 billion in 2021.
Social Commerce is really popular among young people
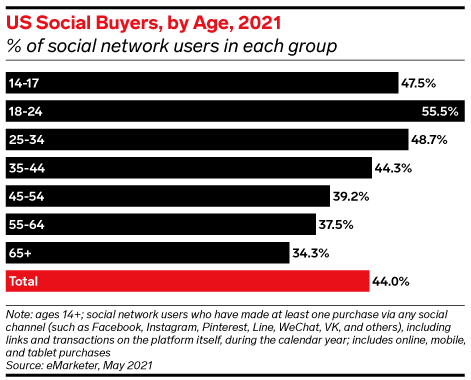
Social commerce is most common among Gen Z consumers in the United States. According to eMarketer’s data, almost 56% of social media users between 18 and 24 have made a purchase on Facebook, Instagram, Pinterest, Line, WeChat, or VK at least once.
Social media becomes less frequently used for purchases as users age. Only about a third of social network users 65 and older have made at least one purchase via social channels.
As Sprout Social reports, 31% of customers prefer using social media to share feedback about products or services, followed by email at 18%. Most businesses get help and assistance through social media channels. In fact, it outpaces dedicated customer service channels and email support. 90% of marketers find that social media data gives them an edge against their competitors.
Social media platforms are important for eCommerce brands because 91% of consumers who follow those types of companies on social media visit their websites and apps. In addition, 90% choose to buy from the brands they follow, 86% prefer the brands they follow over a competitor, and 83% recommend the brands to people they know.
If you don’t have social media accounts for your business yet, these eCommerce statistics showing the benefits of social media should convince you to create some. Having an active presence on social media helps with branding, customer experience, and overall sales.
Consumers see authenticity as a key factor in choosing which brands to support
A report by Stackla found that, even though marketers have created a lot of different types of content, 60% of consumers think user-generated content (UGC) is the most real.
79% of consumers allow UGC to factor into their buying decisions more than influencer or branded content. This is because user reviews and photos give potential customers a better idea of what they’re actually getting, rather than an idealized version put forth by the company. In fact, 58% of online shoppers have abandoned their shopping carts due to the absence of user reviews and pictures.
The best way to generate user-generated content (UGC) is by inviting consumers to join your online community. According to this report, 65% of Gen Z consumers are happy to join brand communities and create content for companies they believe in.
Promotional material is great, but it’s not the only thing that this can do. This can also increase customer loyalty and encourage more online purchases. After all, 61% of consumers are more likely to buy from brands that engage them.
Top Macro eCommerce trends to watch
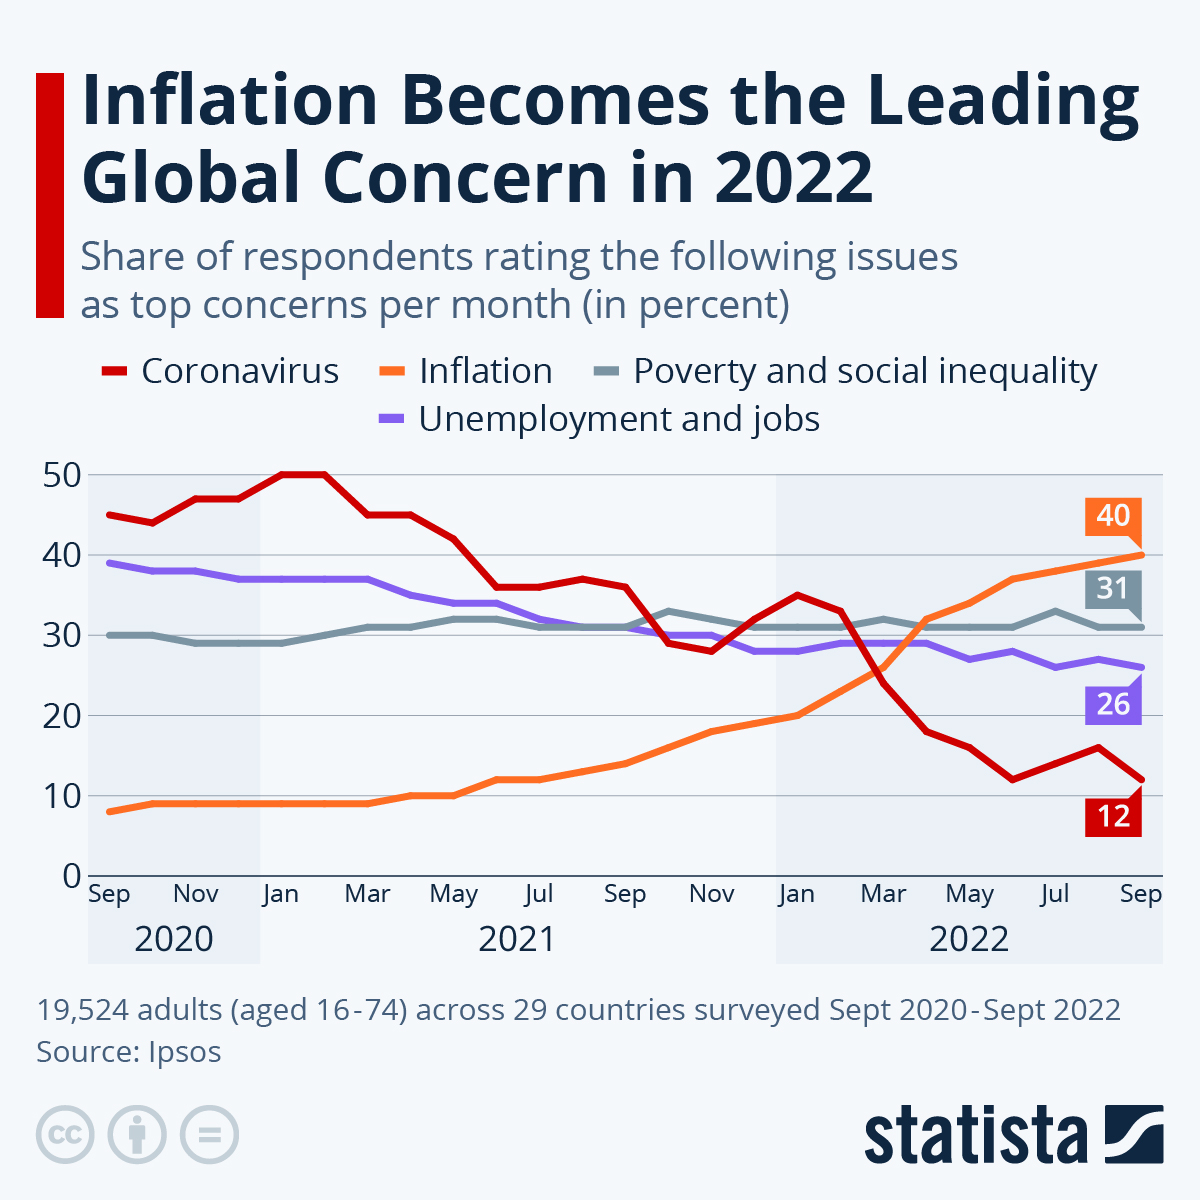
Global Inflation Pressures
According to Statista’s chart below, inflation is now the top global concern for 40% of respondents, eclipsing other major issues such as poverty and social inequality (31%), unemployment and jobs (26%), and coronavirus (12%).
People all around the world are spending money. However, global brands cannot avoid feeling the pressures of inflation. If you’re thinking about venturing into cross-border eCommerce, you must first mull over how much inflation affects different countries.
In an interview with Glossy, Olaplex CEO JuE Wong explained how the company is affected by global inflation, macroeconomics, and geopolitical situations. Even though net sales increased by 38.6% in Q2 2022, Wong says that Olaplex isn’t immune from these problems. As a result, the company will be investing in technology (such as eCommerce solutions) to help advance growth.
Given this concern, it would benefit you to look into the inflation rates of the countries you have in mind and potentially adjust your pricing strategy based on what you find.
Mobile First Trend
The COVID-19 pandemic drastically changed eCommerce trends worldwide. With physical stores forced to close, customers started buying everything they needed online. Some experts say that the virus sped up the transition to online shopping by five years or more.
eCommerce exploded in growth last year due to the pandemic, and even though things are returning to normal, many shoppers have no intention of going back to brick-and-mortar stores. Incisiv – a famous data-analytic company – reports that almost 90% of shoppers who switched to online buying last year plan on continuing their eCommerce habits for at least six more months.
mCommerce, or mobile commerce, is expected to surge in the next few years. This is due in large part to technological advances such as branded shopping apps, 5G wireless connections, and social shopping platforms that make it easier for people to shop on their phones.
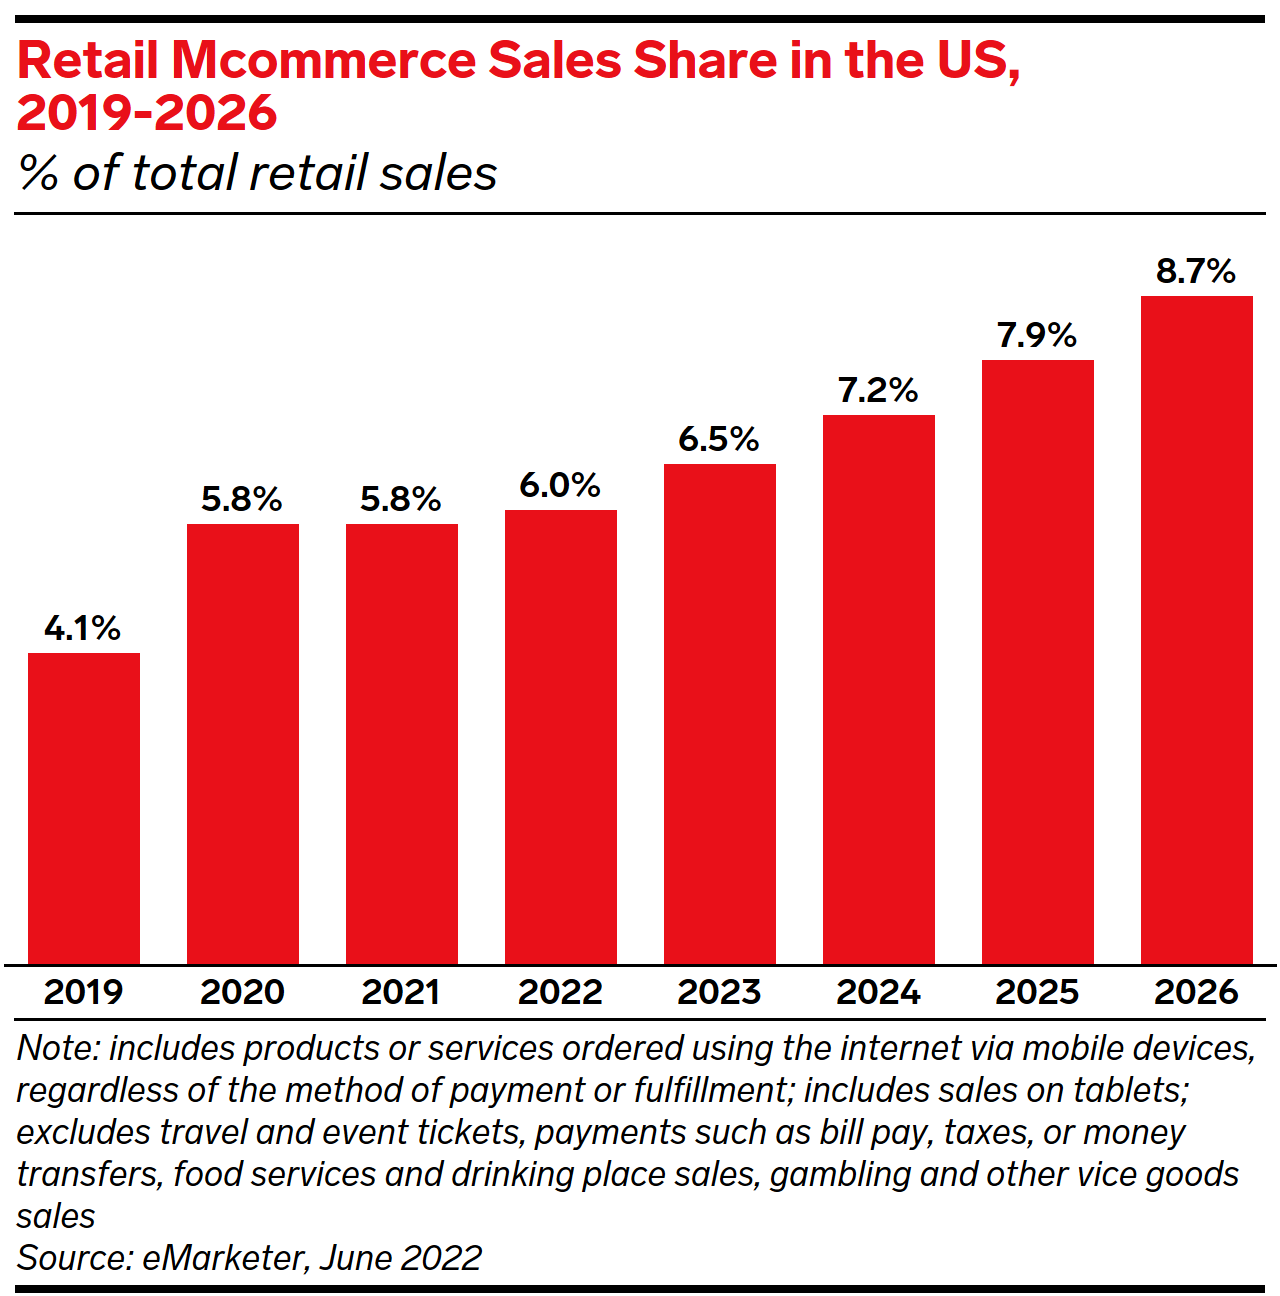
The global use of smartphones and tablets is increasing, which in turn is causing online retail to expand. In 2022, it’s estimated that smartphone retail eCommerce sales will make up 6% of total retail sales in the US, this is an increase from 4.1% in 2019. Mobile shopping apps are becoming more prevalent both among retailers and shoppers. In fact, one out of every five US shoppers reports using them multiple times per day.
Social commerce sales are set to triple by 2025. While only 30% of US consumers report purchasing goods through social platforms, nearly half of China’s consumers already shop on social, generating more than $351 billion in sales in 2021.
With the competition increasing every day, 49% of brands have decided to invest in social commerce content for 2022. This means more branded shopping apps, SMS and Facebook campaigns, as well as TikTok and Instagram videos specifically catered towards promoting a product.
Focusing on Diversity Marketing Methods
Marketing has made remarkable progress in recent years, providing businesses with innovative ways to reach consumers.
Social commerce, which encompasses Facebook and Instagram shopping features as well as TikTok shopping, has been a growing trend over the past five years. Recently, live shopping has surged in popularity, particularly in China. In 2021 alone, the live commerce market racked up $2.27 billion in sales and is expected to increase to nearly $5 billion by 2023.
In contrast, other countries are only just beginning to see live commerce as a potential marketing avenue. In the US, for example, 20% of online shoppers said they’d participated in it before, while 34% said that even though they hadn’t tried it themselves, they’d at least heard of the concept.
Connected TV advertising is a new way to market that uses platforms such as Hulu, Roku, and YouTube. These ads will be no different from regular linear/cable TV commercials in terms of perception by customers. However, when comparing the two types of ads, those on streaming services were found to be better overall.
Also, don’t forget that we have the best marketing method – omnichannel marketing. Customers often use multiple channels when shopping, and sometimes they end up making online purchases even as they stand in line at a physical store or use smartphones as shopping assistants in stores. That’s why 87% of retailers think that the omnichannel marketing strategy is crucial for their business.
A Challenging Global Supply Chain: Always Readily Have at Least 2-3 Suppliers
According to Morris Cohen, Wharton Professor of Operations, Information, and Decisions, the COVID-19 pandemic’s effects on supply chains were as big as “an earthquake or tsunami”. For decades prior, the three main pillars holding up Supply Chain Management were: globalization; low-cost supplies; and minimizing inventory.
When COVID-19 first broke and supply chains around the world were disrupted, companies began to focus on building resilience into their supply chains or ways to keep them from halting completely and restore them quickly if they did.
Disruptions to the supply chain are becoming more regular and severe, as illustrated by Levi’s recent loss in Europe. In 2022, their revenue saw a 19% year-over-year decrease from 2021. According to McKinsey, manufacturing production is being disrupted every 3.7 years on average now.
Predictions say that systems won’t be back to “normal” until 2023, and this is the earliest estimate. Even when they are, the pandemic has shown us that these networks are vulnerable to future events such as political instability, disasters, and changes in regulation. Therefore, each business should prepare at least 2-3 suppliers on their own to face to the worst scenario.
Some experts believe that the current string of supply chain issues is here to stay. They think this is due in part to other global crises which will inevitably affect how goods are manufactured on a large scale. It’s reasonable then to expect future vulnerability from this system to other problems.
Growing Sales in China and APAC
Asia-Pacific’s retail eCommerce sales are projected to surpass the rest of the world by 2023 due to a few reasons. These include:
- Rapid urbanization and technological advancements;
- More than 85% of new middle-class growth resides in APAC;
- A host of government initiatives led by China in collaboration with private companies.
By 2022, China’s eCommerce sales are expected to total a staggering $2.8 trillion, which is more than double the US market.
Many difficulties exist when trying to do business with China, especially in comparison to other APAC countries. These obstacles can be boiled down to a handful of challenges, which include:
- The slow loading speed of websites on foreign servers in China has a negative impact on both conversion rates and search engine rankings.
- Even though Chinese companies can enter western markets, advertising and social content via Facebook, Instagram, YouTube, and Google are unavailable in China.
Shopify teamed up with Chinese eCommerce behemoth JD.com in order to take advantage of the growing global trend of online shopping. Now, any US eCommerce business that uses a Shopify store can list their products on the Chinese marketplace, which boasts over 550 million shoppers.
JD.com offers a quick and efficient way to get your products from the US to China, with cargo flights transporting goods from its warehouses straight to customers’ doorsteps. This cuts down the time it takes for foreign brands to start selling in China from 12 months all the way down to just 3-4 weeks.
Creating Content in The Local Language
In a study from Flow.io, it was found that over two-thirds of English-speaking shoppers said they would not purchase from a website if it wasn’t translated into English. In Japanese and South Korean markets where cross-border commerce is lowest, this percentage rose to 41% and 36%.
Displaying your site in your native language dramatically increases the likelihood of closing a sale with international clients. Creating a good customer experience is essential to maintaining this business relationship. The majority of shoppers in Flow.io’s report noted that the following pages should be written in their own language for clarity:
- Product descriptions (67%)
- Product reviews (63%)
- Checkout process (63%)
CSA Research recently surveyed 8,709 global consumers from 29 countries and discovered that 65% of respondents said they prefer content in their native language, even if it’s low quality. Furthermore, 40% claimed they don’t make purchases on websites written in other languages.
The final finding is significant and warrants further exploration. People often think that localization must be an exhausting, black-or-white task (either every detail has to change for each country or it’s not worth the effort). However, this isn’t the case.
From the survey, we can see that people place importance on website navigation and content. This means that a company does not have to invest in translating its whole site from the beginning. It is more important to focus on getting heavily used areas of the site perfect: headlines, product titles… Once you’ve gotten some traction with your original language content, then it would make sense to do full-scale translation using a native copywriter and localized idioms.
Micro eCommerce trends
Omnichannel Selling
The future of eCommerce is a blend of online and physical retail experiences. 80% of consumers consider the landscape a blend of both, so businesses that adopt an omnichannel selling approach will have a competitive advantage. Omnichannel selling integrates multiple platforms and channels to provide a seamless experience between them. This may involve websites, web apps, online marketplaces, and brick-and-mortar stores.
One way to get started with omnichannel selling is by having a mobile-friendly website. By 2024, mobile shopping will make up 44.2% of all eCommerce sales, so it’s a great way to stay ahead of the competition.
You might think that since you have a great eCommerce site or app, selling on online marketplaces wouldn’t be worth your time. However, many consumers prefer the one-stop convenience of buying everything they need in one place. Plus, most marketplaces provide free shipping and returns.

If your brand is still fresh, take advantage of high traffic volume and sell at top marketplaces in your area. On the other hand, if your brand has been around for a while, use these same marketplaces to navigate customers to your website.
Your business can also offer Click and collect service, which enables consumers to check out online and collect their purchases at the store or pickup station. This model offers the convenience of online shopping, quick in-store visits, and zero shipping charges.
Customer Relationship Management (CRM)
Negative customer interactions can quickly lead to a loss of business, so it’s crucial for eCommerce companies to have excellent customer relationship management. According to statistics, 92% of customers would abandon business after just two or three poor experiences. Therefore, CRM tools and strategies are essential in the eCommerce industry.
CRM provides business owners with a greater understanding of their customer’s needs and behavior. By developing stronger relationships, businesses can create a base of loyal customers.

According to an estimate, the CRM market size will reach $128 billion by 2028 and grow at a rate of 12% annually. Moreover, nearly all businesses with 10 or more employees use CRM platforms to track customer interactions.
Companies that offer loyalty or rewards programs improve customer retention rates by 5% and increase profits by 25%-95%. In fact, 75% of customers prefer companies with such programs. Therefore, CRM tools help businesses improve customer engagement and grow. Investing in a CRM tool is a great idea for any business.
Increasing Customer Support Service Quality
Excellent customer support service is and will always be key to the success of any business. If customers have problems with your products or services, they may very well take their business elsewhere. In the end, it falls on the company to provide quality support when issues arise.
81% percent of customers say that positive support encourages them to come back and buy again. Also, reply time is key when speaking with customer service when 60% of customers believe that 10 minutes or less is an acceptable response time.
Live chat has become the preferred customer support method because consumers demand instant interaction. 41% of consumers choose live chat over other channels, such as phone and email, because it offers immediate help with minimal effort. Using live chat is more affordable for businesses than phone support, and it’s also more efficient. A single live chat agent can simultaneously help multiple customers, which in turn decreases response time and improves customer experience.

Many companies are now using chatbots as their initial form of customer service, due to the increasing demand for real-time assistance. Chatbots use machine learning, artificial intelligence, and natural language processing (NLP) in order to talk to users conversationally. They can help answer simple questions and determine if a customer needs further support from an agent.
If your brand has an international audience, providing multilingual chatbots can help you connect with them better. It removes the language barrier that can prevent customers from getting the support they need.
Headless eCommerce
Headless eCommerce allows you to separate the front end and back end of a website or application so that you can deliver content to any front-end framework using APIs.
With this eCommerce solution, shopping is not only limited to desktops, laptops, and mobile devices. Consumers can browse and purchase through the Internet of Things (IoT) devices such as smart speakers, fitness trackers, and home assistants.
Unifying all shopping experiences, increasing flexibility, and opening up sales possibilities are only a few of the many benefits of headless eCommerce. This type of eCommerce can also streamline omnichannel selling since businesses utilizing a headless approach can quickly incorporate new eCommerce channels.
Conversion Rate Optimization
A major goal for any eCommerce website is to turn browsers into buyers. You can do this by employing conversion rate optimization, or CRO. This involves making changes to your website so that visitors are more likely to purchase your products or sign up for your newsletter.
eCommerce site optimization is a great place to start developing your online strategy. By touches we mean every interaction between the customer and the company, here are some ideas to get you started:
- Use landing pages to increase website leads: Research shows that websites with more than 30 landing pages generate 7 times more leads compared to those without them. When creating a landing page, keep the copy straightforward to minimize distractions.
- Effective call-to-action button: Use colors that contrast well, write persuasive copy, and create a sense of urgency.
- Make your eCommerce site available for mobile users: more and more people are shopping on their phones, so it’s crucial to have a mobile-friendly store. This makes it easier for customers to shop while they’re on the go.
- Test your website’s usability: two versions of a webpage or CTA can be compared by A/B testing to measure how successful a CRO strategy is. According to statistics, 60% of companies are already doing this kind of testing, and 34% more have plans to do so in the future.
Voice Search
CouponFollow’s survey results show that approximately 47% of shoppers have used voice commands to make an online purchase, with 58% satisfaction rates. The 61% of respondents who use voice technology to capture shopping habits said they did so to repurchase saved orders. This is likely because the most frequently purchased items via voice shopping are daily necessities, such as groceries (48%).
The voice search market is expected to grow 23.7% annually, increasing from $11.21 billion in 2022 to $49.79 billion by 2029.
Despite a promising market, voice shopping still experiences several drawbacks. For example, 40% of shoppers find it difficult to browse products via this method and results can inaccurately be provided. Also, 31% of users are worried about their privacy when using these tools, and 27% fear the safety of their financial information.

Although many companies strive to show customers that voice shopping is secure, it’s still a new way to shop online. It may take some time before the majority of people feel comfortable using this method.
If you want your eCommerce store to be optimized for voice search, then you need to focus on getting the top spot on Google. This is because it reads the highest-ranking content first and searchers usually ask complete questions instead of just using keywords.
Apply Artificial Intelligence to Personalization
AI technologies are based on human intelligence, which allows businesses to give customers more accurate and helpful results. AI can learn and adapt according to customer behavior, giving companies the opportunity to improve their customer’s experience. Many aspects of eCommerce can use AI technology, but the top area where businesses implement it is personalization.
The global personalization software market is progressing at a CAGR of 23.5% and is expected to reach over $2 billion by 2027, which would be more than double the estimated $764 million in 2021.

Personalization provides users with product recommendations and targeted email campaigns that match their interests. By giving customers a quality personalized experience, businesses can keep them coming back without excessive marketing. Personalization also lowers customer acquisition costs.
If you want loyal customers who keep coming back, give them a personalized shopping experience. Most consumers expect companies to be proactive and suggest products they might need in the future. In fact, product recommendations could make up for 31% of your eCommerce store’s revenue.
Subscription Models
In recent years, shoppers have become more and more accustomed to the convenience of online shopping. The subscription model is one of the most practical solutions for fulfilling recurring expenses.
The subscription market is growing rapidly, with an estimated CAGR of 68%. It is expected to reach $478 billion by 2025. Another study shows that customers anticipate an increase in subscription use of 27%.
The subscription model is vital to the future of eCommerce growth and expansion, with 70% of business leaders agreeing. However, the churn rate remains one of the main challenges for this digital business model.
Subscription churn can be costly for businesses, but there are some easy ways to reduce it. Offer your subscribers special perks like free delivery or lower prices, and make sure to keep them updated about changes in their service, like delayed deliveries. Good communication helps build customer trust and loyalty.
Diverse Payment Options
Do not turn away potential customers only because your site does not have their preferred payment method. To get ahead of future trends in eCommerce, marketers should start offering popular and alternative payment options on their sites.
Digital and mobile wallets are continuing to grow in popularity, accounting for 49% of global eCommerce transactions in 2021. They are expected to be used for about 53% of all eCommerce transactions by 2025. Credit cards came second with a 21% market share, followed by debit cards (13%), bank transfers (7%), and the buy now, pay later (BNPL) solutions (3%).
For online purchases, we recommend offering these transaction methods:
- eWallets (including mobile payments, like Apple Pay)
- Credit cards
- Debit cards
- Bank transfers
Providing an alternative payment scheme, such as BNPL, can give your business a competitive edge. BNPL allows customers to pay for products in installments, which makes it accessible to many customers. By offering this option, you can improve customer confidence and purchase experience.
Fast & Free Delivery Service
After making an online purchase, customers expect to receive their items almost immediately. Unfortunately, only a dismal 15% of eCommerce shoppers are satisfied with product delivery speeds.
Due to this customer preference, lots of eCommerce stores are now offering shorter shipping times. For example, Amazon improved its delivery speed by establishing inventory warehouses all over the world.

As well as speed, business owners should also be aware of the tendency for free or affordable shipping. The Jungle Scout Consumer Trends report reveals that 72% of US online shoppers seek products with the lowest shipping prices. In other words, many people are more influenced by shipping costs than the actual product prices.
In the future, both shipping speed and price will continue to be important in eCommerce. If you can’t offer fast deliveries or advanced warehousing, it’s worth offering discounted or free shipping as an incentive.
In conclusion,
With the increasing popularity of online shopping, the market has become oversaturated. Staying up-to-date with the eCommerce industry is essential to navigating this market effectively. In this article, you’ll find stats about the eCommerce market in general, consumer behavior, mobile shopping, social media marketing, macro, and micro trends. We’ve also provided suggestions on how to use each statistic for increased returns.
The data, reports, and statistics presented above should be evidence enough that eCommerce is not a choice but rather a business necessity. The future success of your company may depend on it. Hopefully, this article has helped you understand the state of the industry and where it is headed. If you still have questions or need assistance developing an eCommerce business, please contact our experts for advanced consultancy services.