
Debugging plays a crucial role in the development process of any system. While developers have different preferences, such as logging or printing information on the screen, most opt for run-time debugging. Effectively debugging your application is predictably essential and can save you a significant amount of time and effort.
When it comes to debugging Magento 2 code, you have the option to use either XDebug or Zend Debug. In this article, we focus on installing and configuring Xdebug, as it is widely favored and known for its user-friendly nature. It is worth mentioning that the IDE used in this article is PhpStorm.
Ready? Let’s start with the most important thing: Install XDebug.
Table of Contents
Install XDebug
From now on we assume you have your web server running Ubuntu locally on /var/www/html/. First, you have to put a file named info.php there, with the content:
<?php
phpinfo();
?>
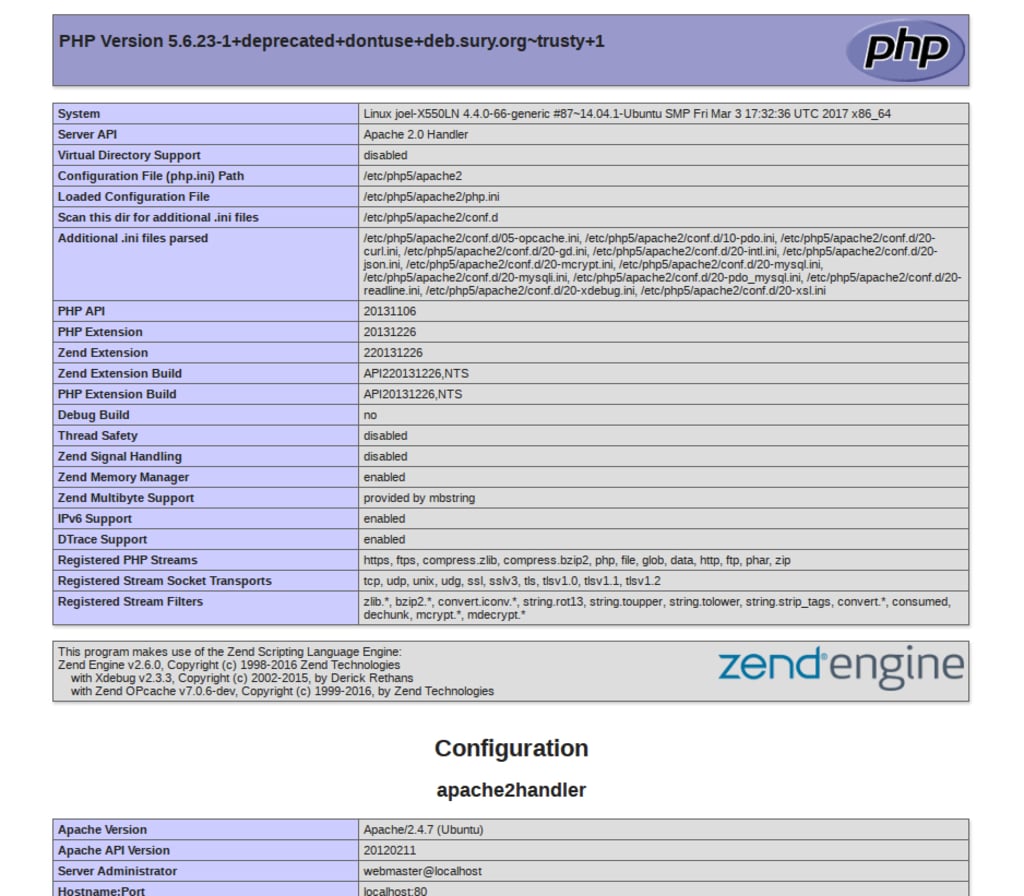
Then go to 127.0.0.1/info.php, and the following screen should display:
Now to install Xdebug, open the terminal and type in the following command:
sudo apt-get install php5-xdebug
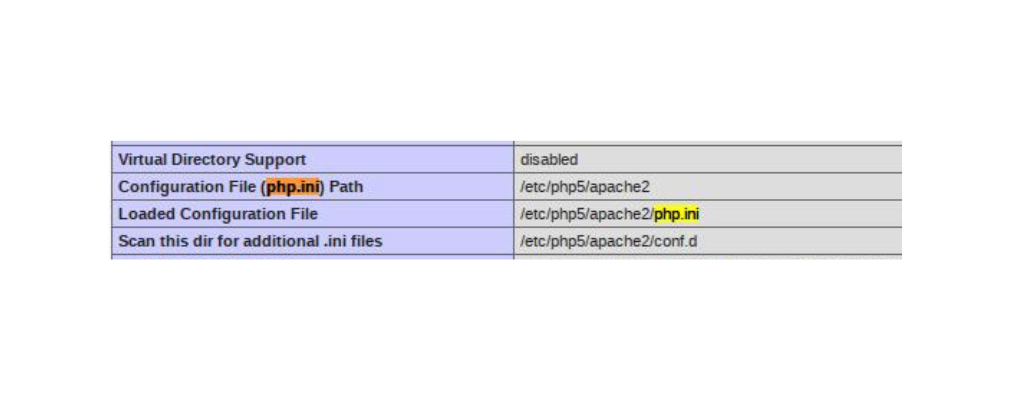
Here you have your Xdebug installed. However, we need to add some config script to set up Xdebug locally. Check your info.php again, look for this line where you can get the php.ini file location.
Go there and paste the following code into the end of the file
zend_extension=”/usr/lib/php5/20131226/xdebug.so”
xdebug.remote_enable=1
xdebug.remote_handler=dbgp
xdebug.remote_mode=req
xdebug.remote_host=localhost
xdebug.remote_port=9000
xdebug.max_nesting_level=300
xdebug.ide_key=’PHPSTORM’
xdebug.remote_connect_back=1
One thing worth mentioning is the zend_extension variable. The number might change depending on your machine. If you are running on PHP 7 then it would be /usr/lib/php7/20131226/xdebug.so
You will need to restart Apache to apply the changes:
Sudo service apache2 restart
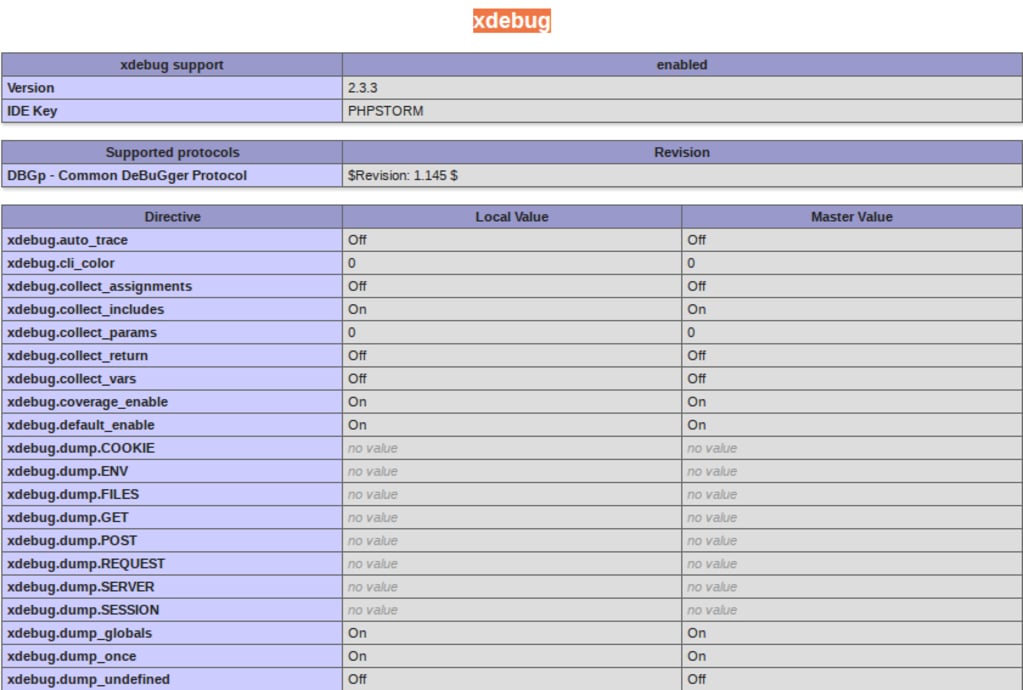
Now take a look again at phpinfo, if you can see this part then it is configured correctly.
Setup XDebug with PhpStorm
In order to use Xdebug to debug Magento 2, you have to setup it up with your IDE (in our case it is PhpStorm). In PhpStorm windows, you need to go to File -> Settings -> Languages & Frameworks -> PHP and set the CLI interpreter.

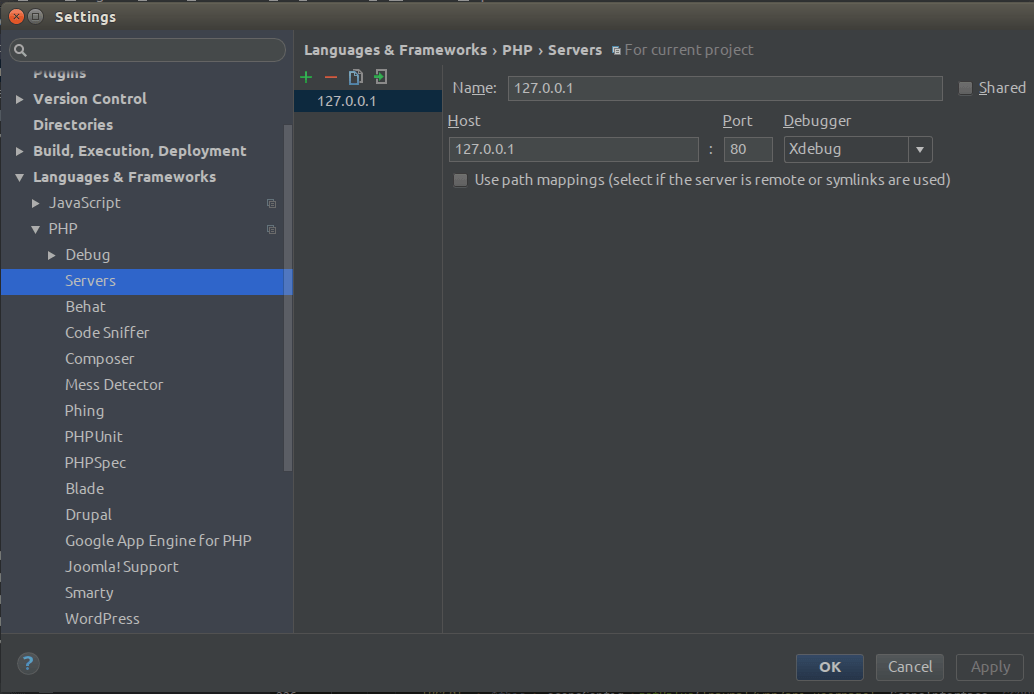
Then go to Servers and set up a debug server. Additionally, you can set up several ones if you want.
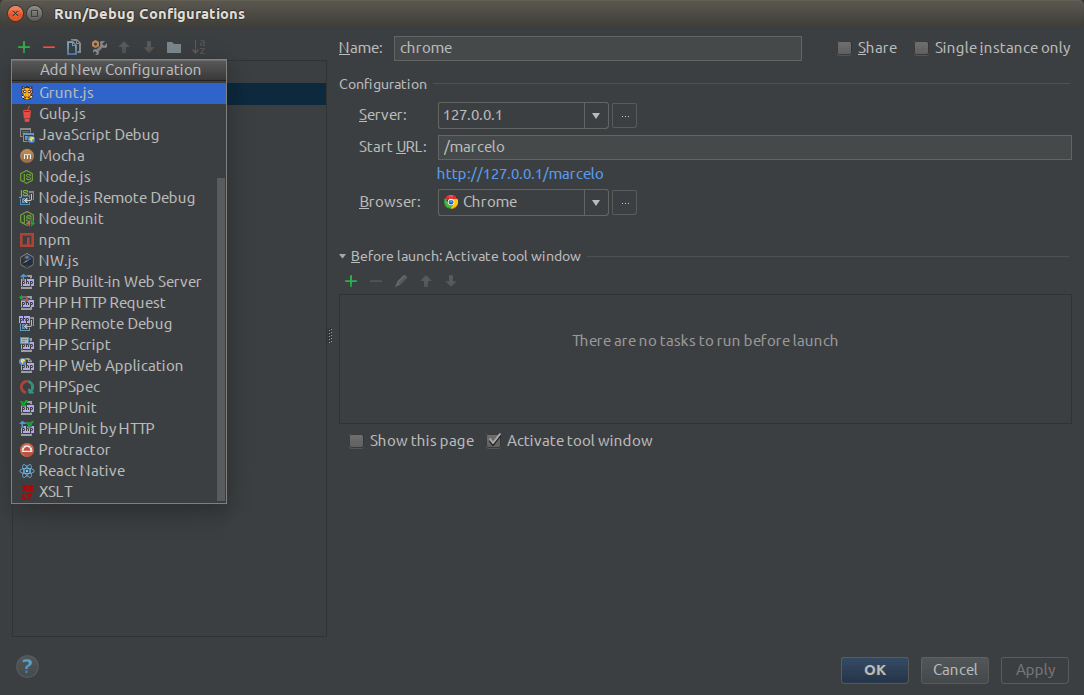
Save the config, then go to Run -> Debug Configuration and add a PHP Web Application debug config.
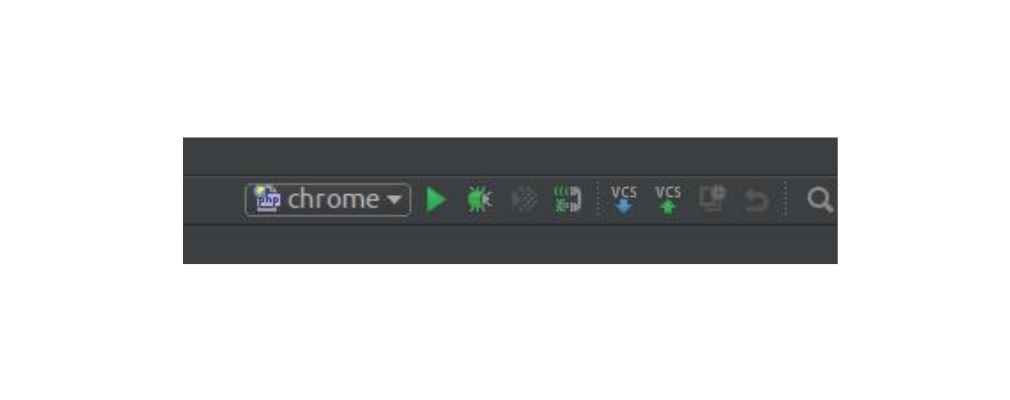
Then look at the upper right corner, you will see the debug listener is now clickable. It means your PhpStorm is ready to listen to debug signals
Now there are two ways that you can get started with debugging, the first way is clicking on the green bug, then a new browser page will load up and you can start your debugging from that point
Alternatively, you can install Xdebug helper extensions for browsers, Chrome, and Firefox, so that it can send debugging signal out to PhpStorm to catch it.
With Chrome: Xdebug helper
With Firefox: The easiest Xdebug
Conclusion
Have you finished all these setups with ease? However, remember that’s just our first part. In the second part, we discuss how to debug Magento 2 code effectively with Xdebug and PhpStorm.
If you face any problems while setting up and configuring or are keen on our Magento development services, contact us now! We guarantee that at Magenest we provide top-notch services for an unbeatable price.